Demo portfolio
Connect to one of 32 brokers and see the below dashboard with your data — true cost basis, roll history, and P&L that actually makes sense.
Loading portfolio data...
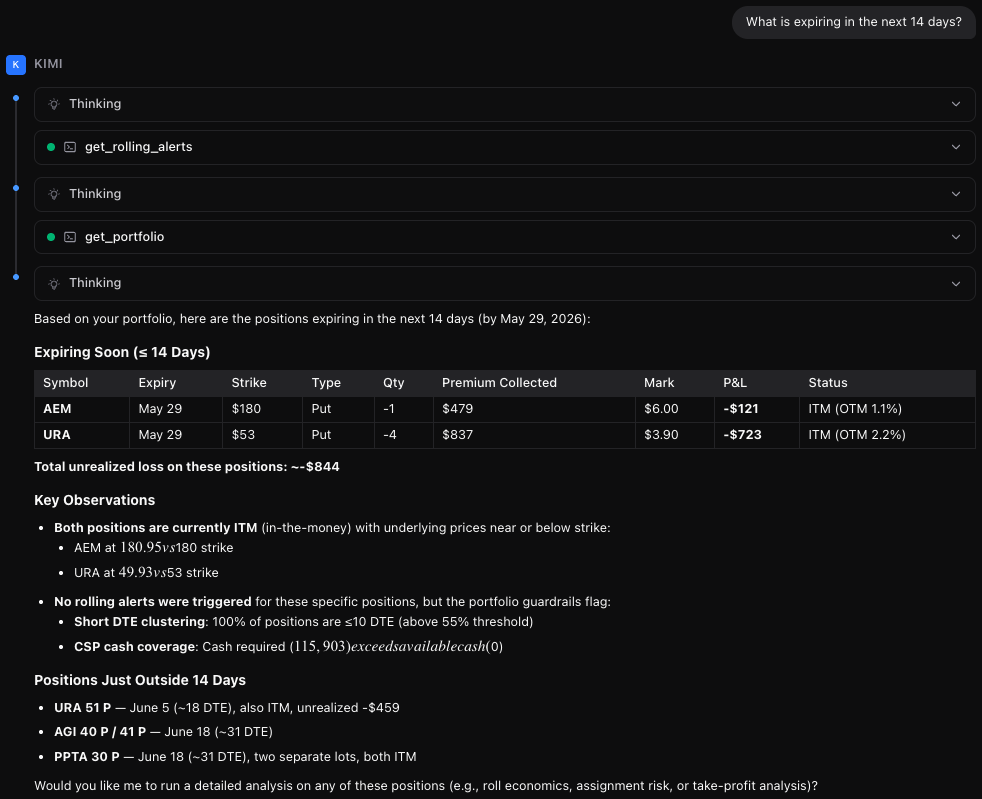
This demo portfolio is AI-ready. With a Pro plan, you can connect ChatGPT, Claude, Cursor, Gemini, Windsurf, or any MCP-compatible AI tool and ask questions like:
Generate a scoped key from your Profile page
Add the config to your MCP-compatible AI app
Start asking about positions, scans, and rolls