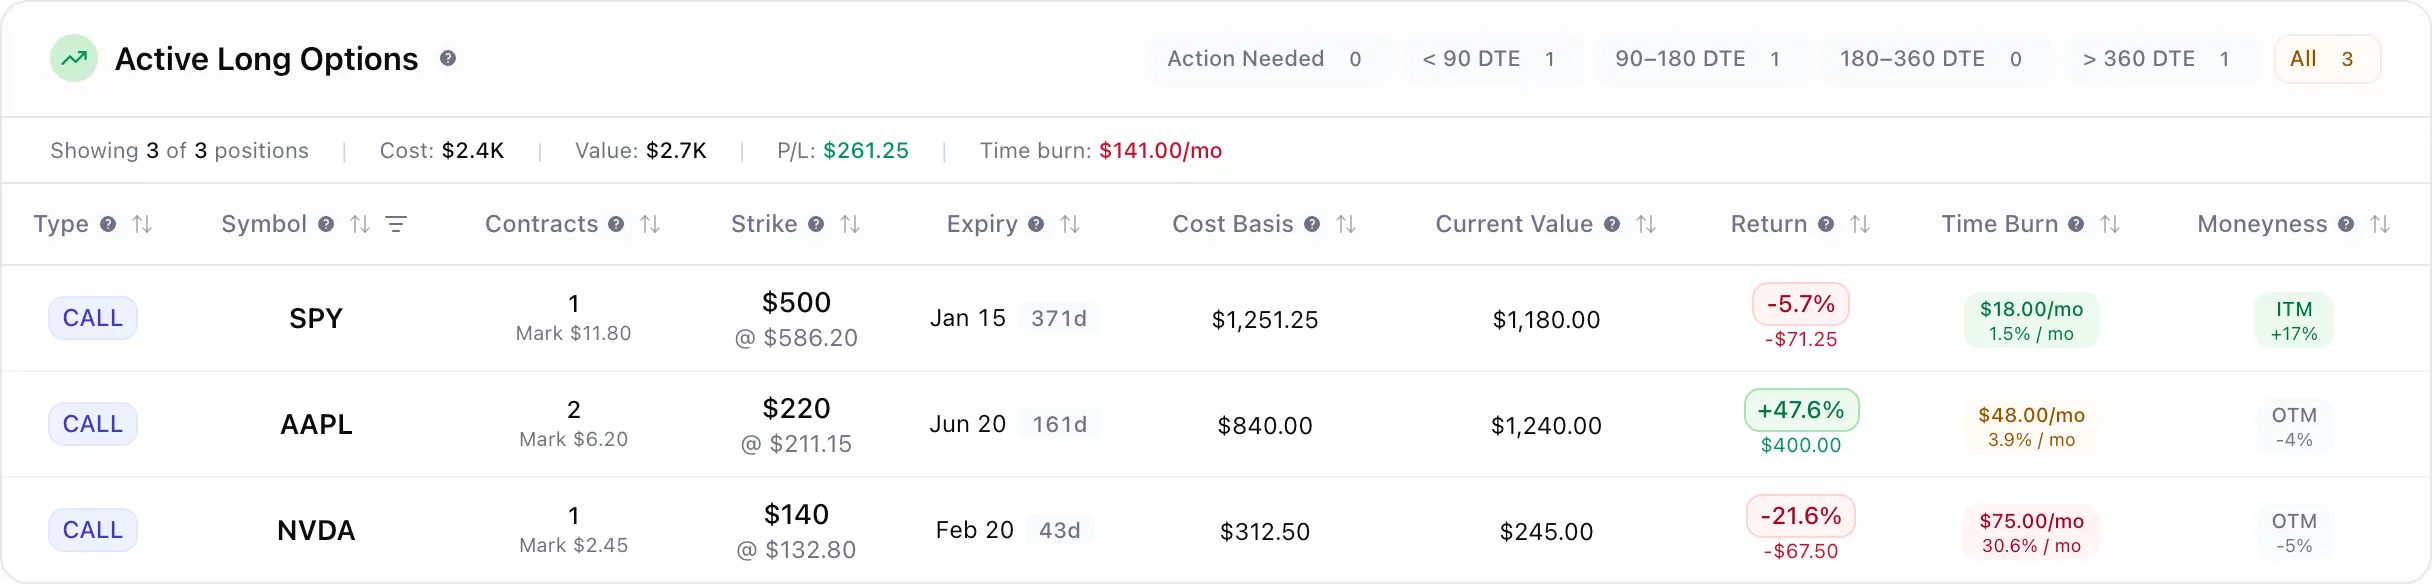
tastytrade shows you trades. We show you what they mean. Track long calls and puts alongside your shares, covered calls, credit spreads, and everything in between — all with true cost basis, roll history, and P&L that actually makes sense.
General information only. Not financial advice.
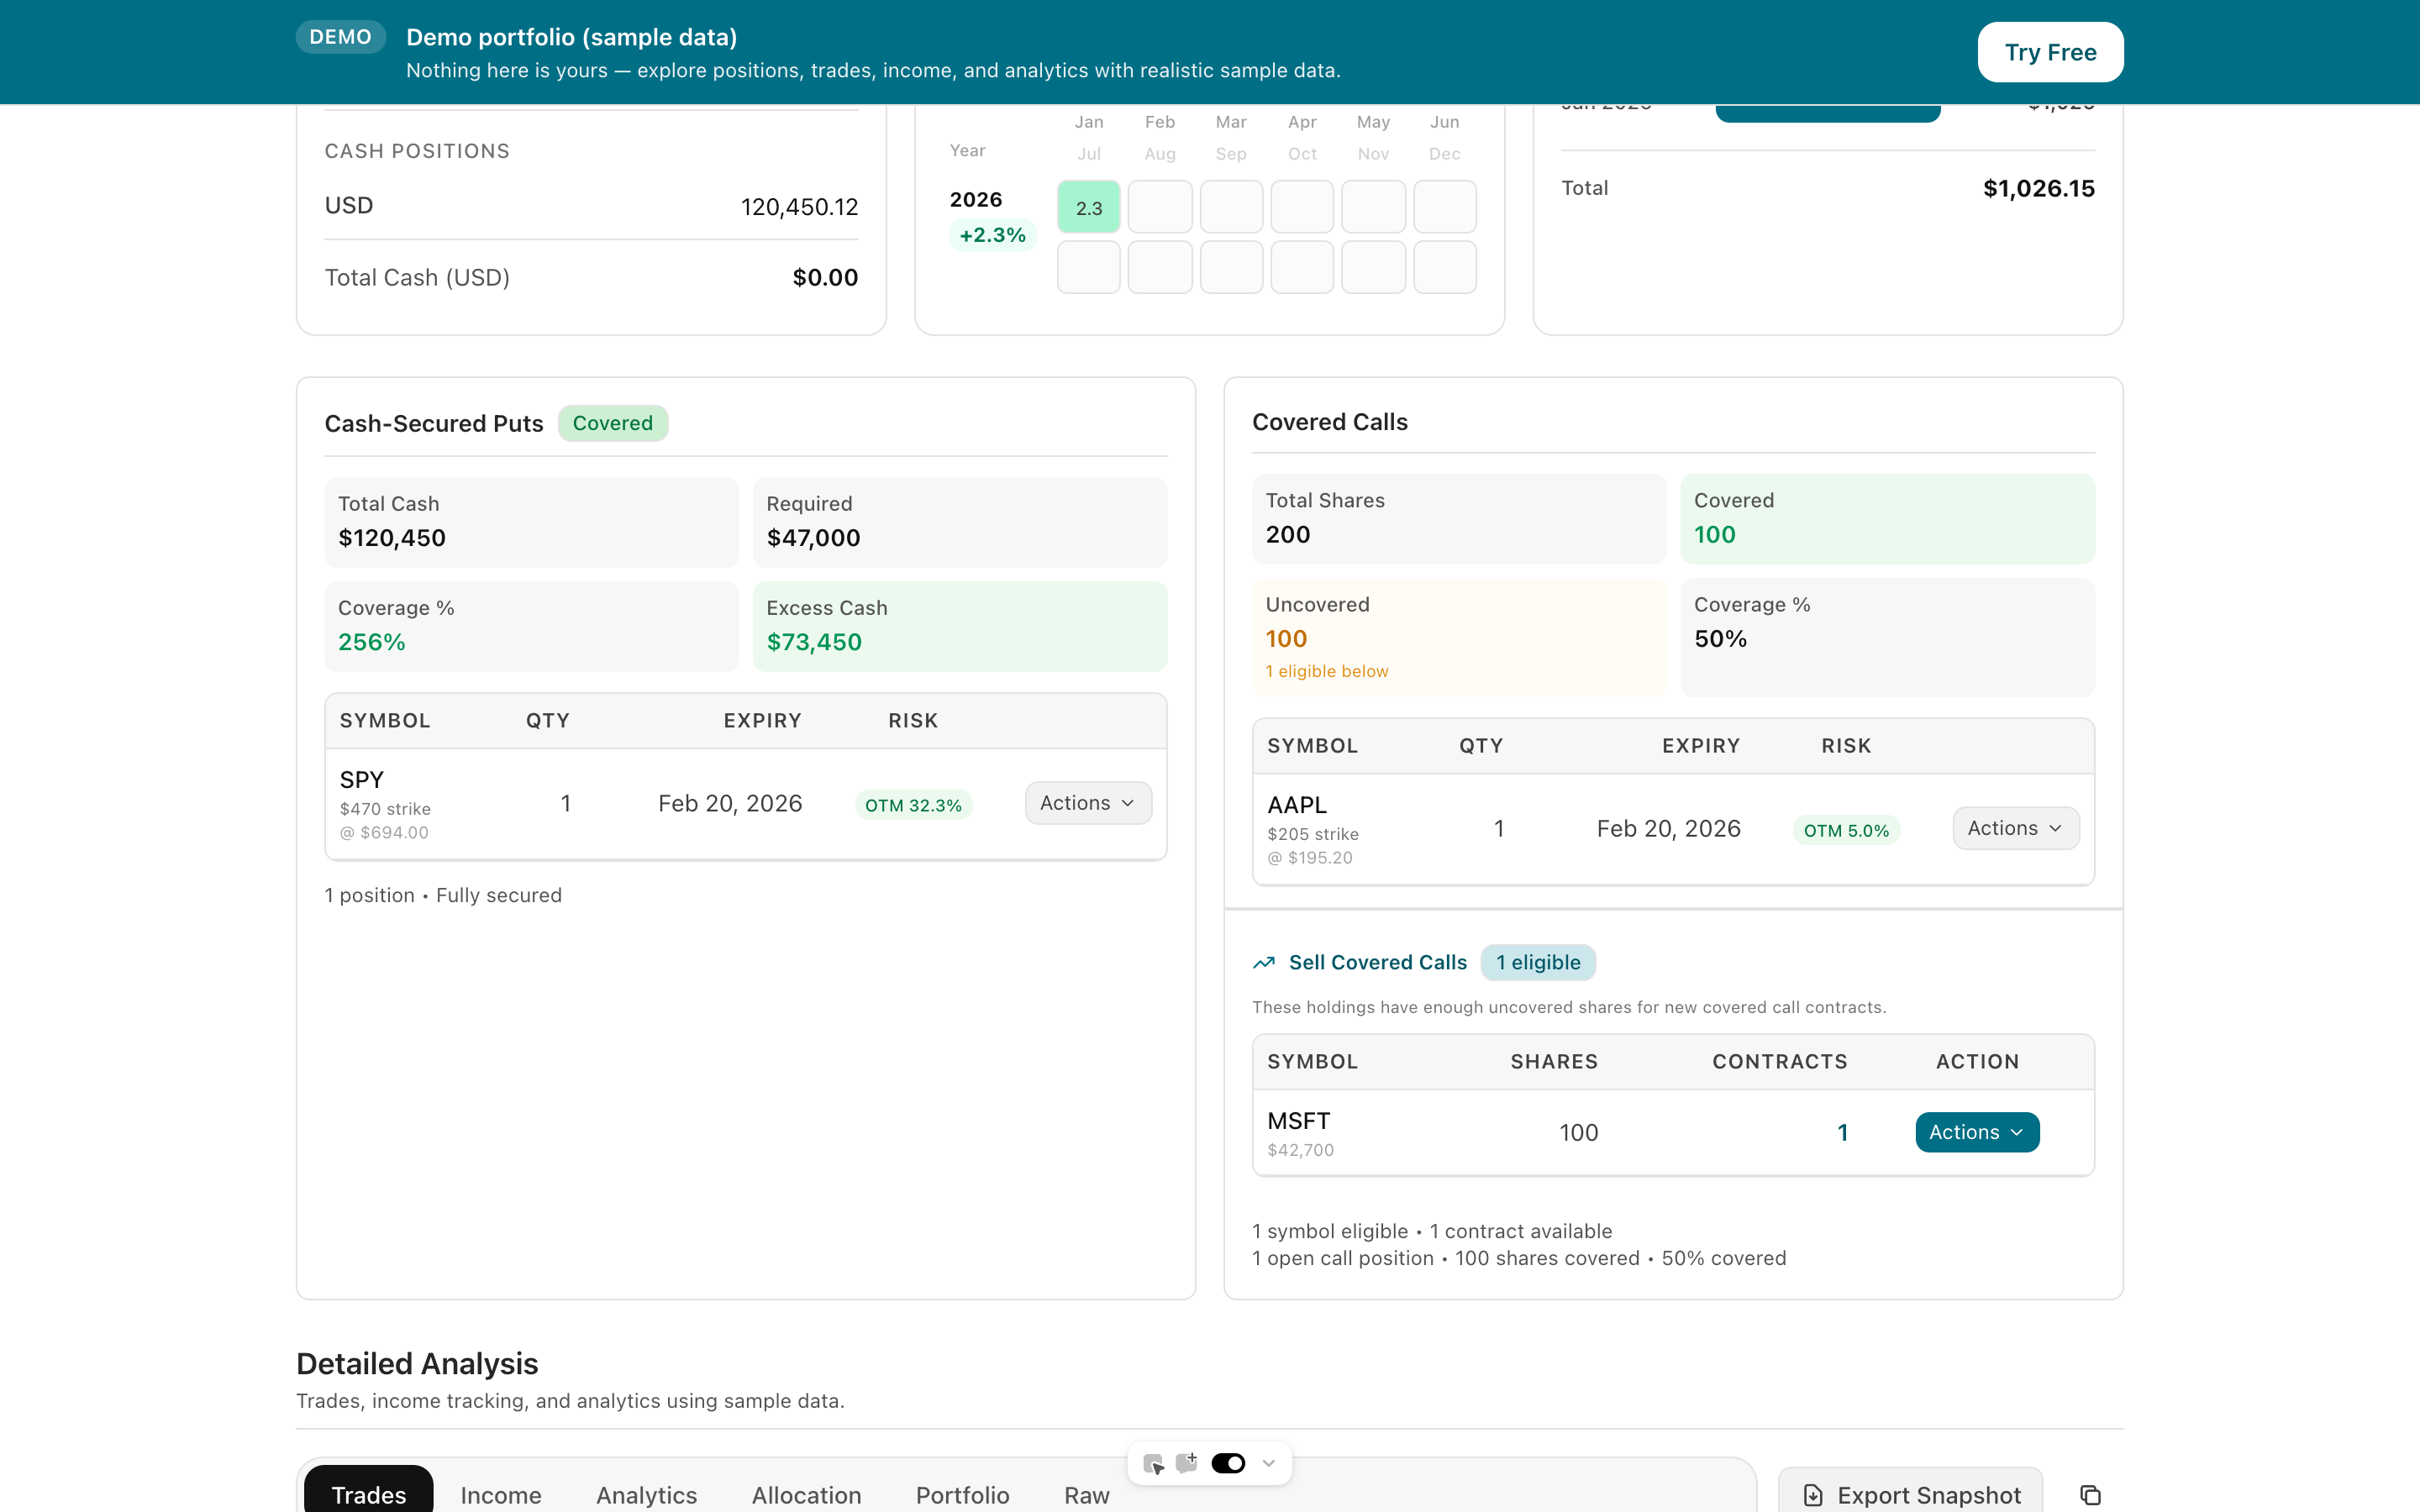
Your broker shows you trades. We show you positions. See spreads, long calls, protective puts, and shares in one view — with true cost basis, per-leg P&L, and roll history that actually makes sense.
The core promise
Whether you sold a covered call or bought a LEAPS spread, you should know exactly where you stand — without building your own spreadsheet.
Tap to view full size
Covered calls and cash-secured puts are two sides of the same idea: pick a price you are happy with, and get paid while the market decides whether to hit it.
The key trade
You exchange some flexibility for immediate cash flow. The strike is your price, not a prediction.
Tap to view full size
The base engine is boring on purpose. A smaller slice of collected premium can fund long-dated calls on high-conviction themes. Defined risk, allocated from income rather than capital.
A simple allocation story
Keep most of the portfolio in wheel-friendly assets, then allocate only 10%–30% of collected premium to a small LEAPS allocation. If the thesis fails, the loss is limited to that budget.
Tap to view full size
Tap to view full size
Interactive calculator
Adjust your monthly wheel income and allocation % to see the barbell in action.
Conservative estimate based on 1-2% monthly yield on cash-secured positions.
One +300% winner returns $56,000— that's a 47x your entire annual LEAPS budget from a single position.
Each LEAPS is only 233% of your annual budget. One +300% winner returns $56,000 — enough to fund your LEAPS program for 47years. The wheel base keeps generating income regardless. That's the barbell: boring base + lopsided upside.
Sell a cash-secured put on a quality ticker. If assigned, sell a covered call. If called away, you are back to cash and can restart. Both legs are just paid limit orders around the same asset.
Have cash ready and a target stock
Have cash ready and a target stock in mind.
Set your desired entry price and collect premium.
Keep premium, back to step 1
You own the stock, continue
Set your target exit price and collect more premium.
Keep premium and shares, repeat step 3
Stock sold, back to step 1
Tap to view full size
Tap to view full size
Tap to view full size
These aren't rules to memorise. They are the defaults that keep an options strategy from turning into something it shouldn't be.
Only sell covered calls on tickers you are comfortable owning long-term. Positions should survive assignment without regret.
Covered calls limit your upside. Know your strike before you sell. Backtesting confirms the expected trade-off on each ticker.
Size the convex allocation from collected premium—not from underlying capital. A defined-risk loss hurts less than a capital loss.
Tap to view full size
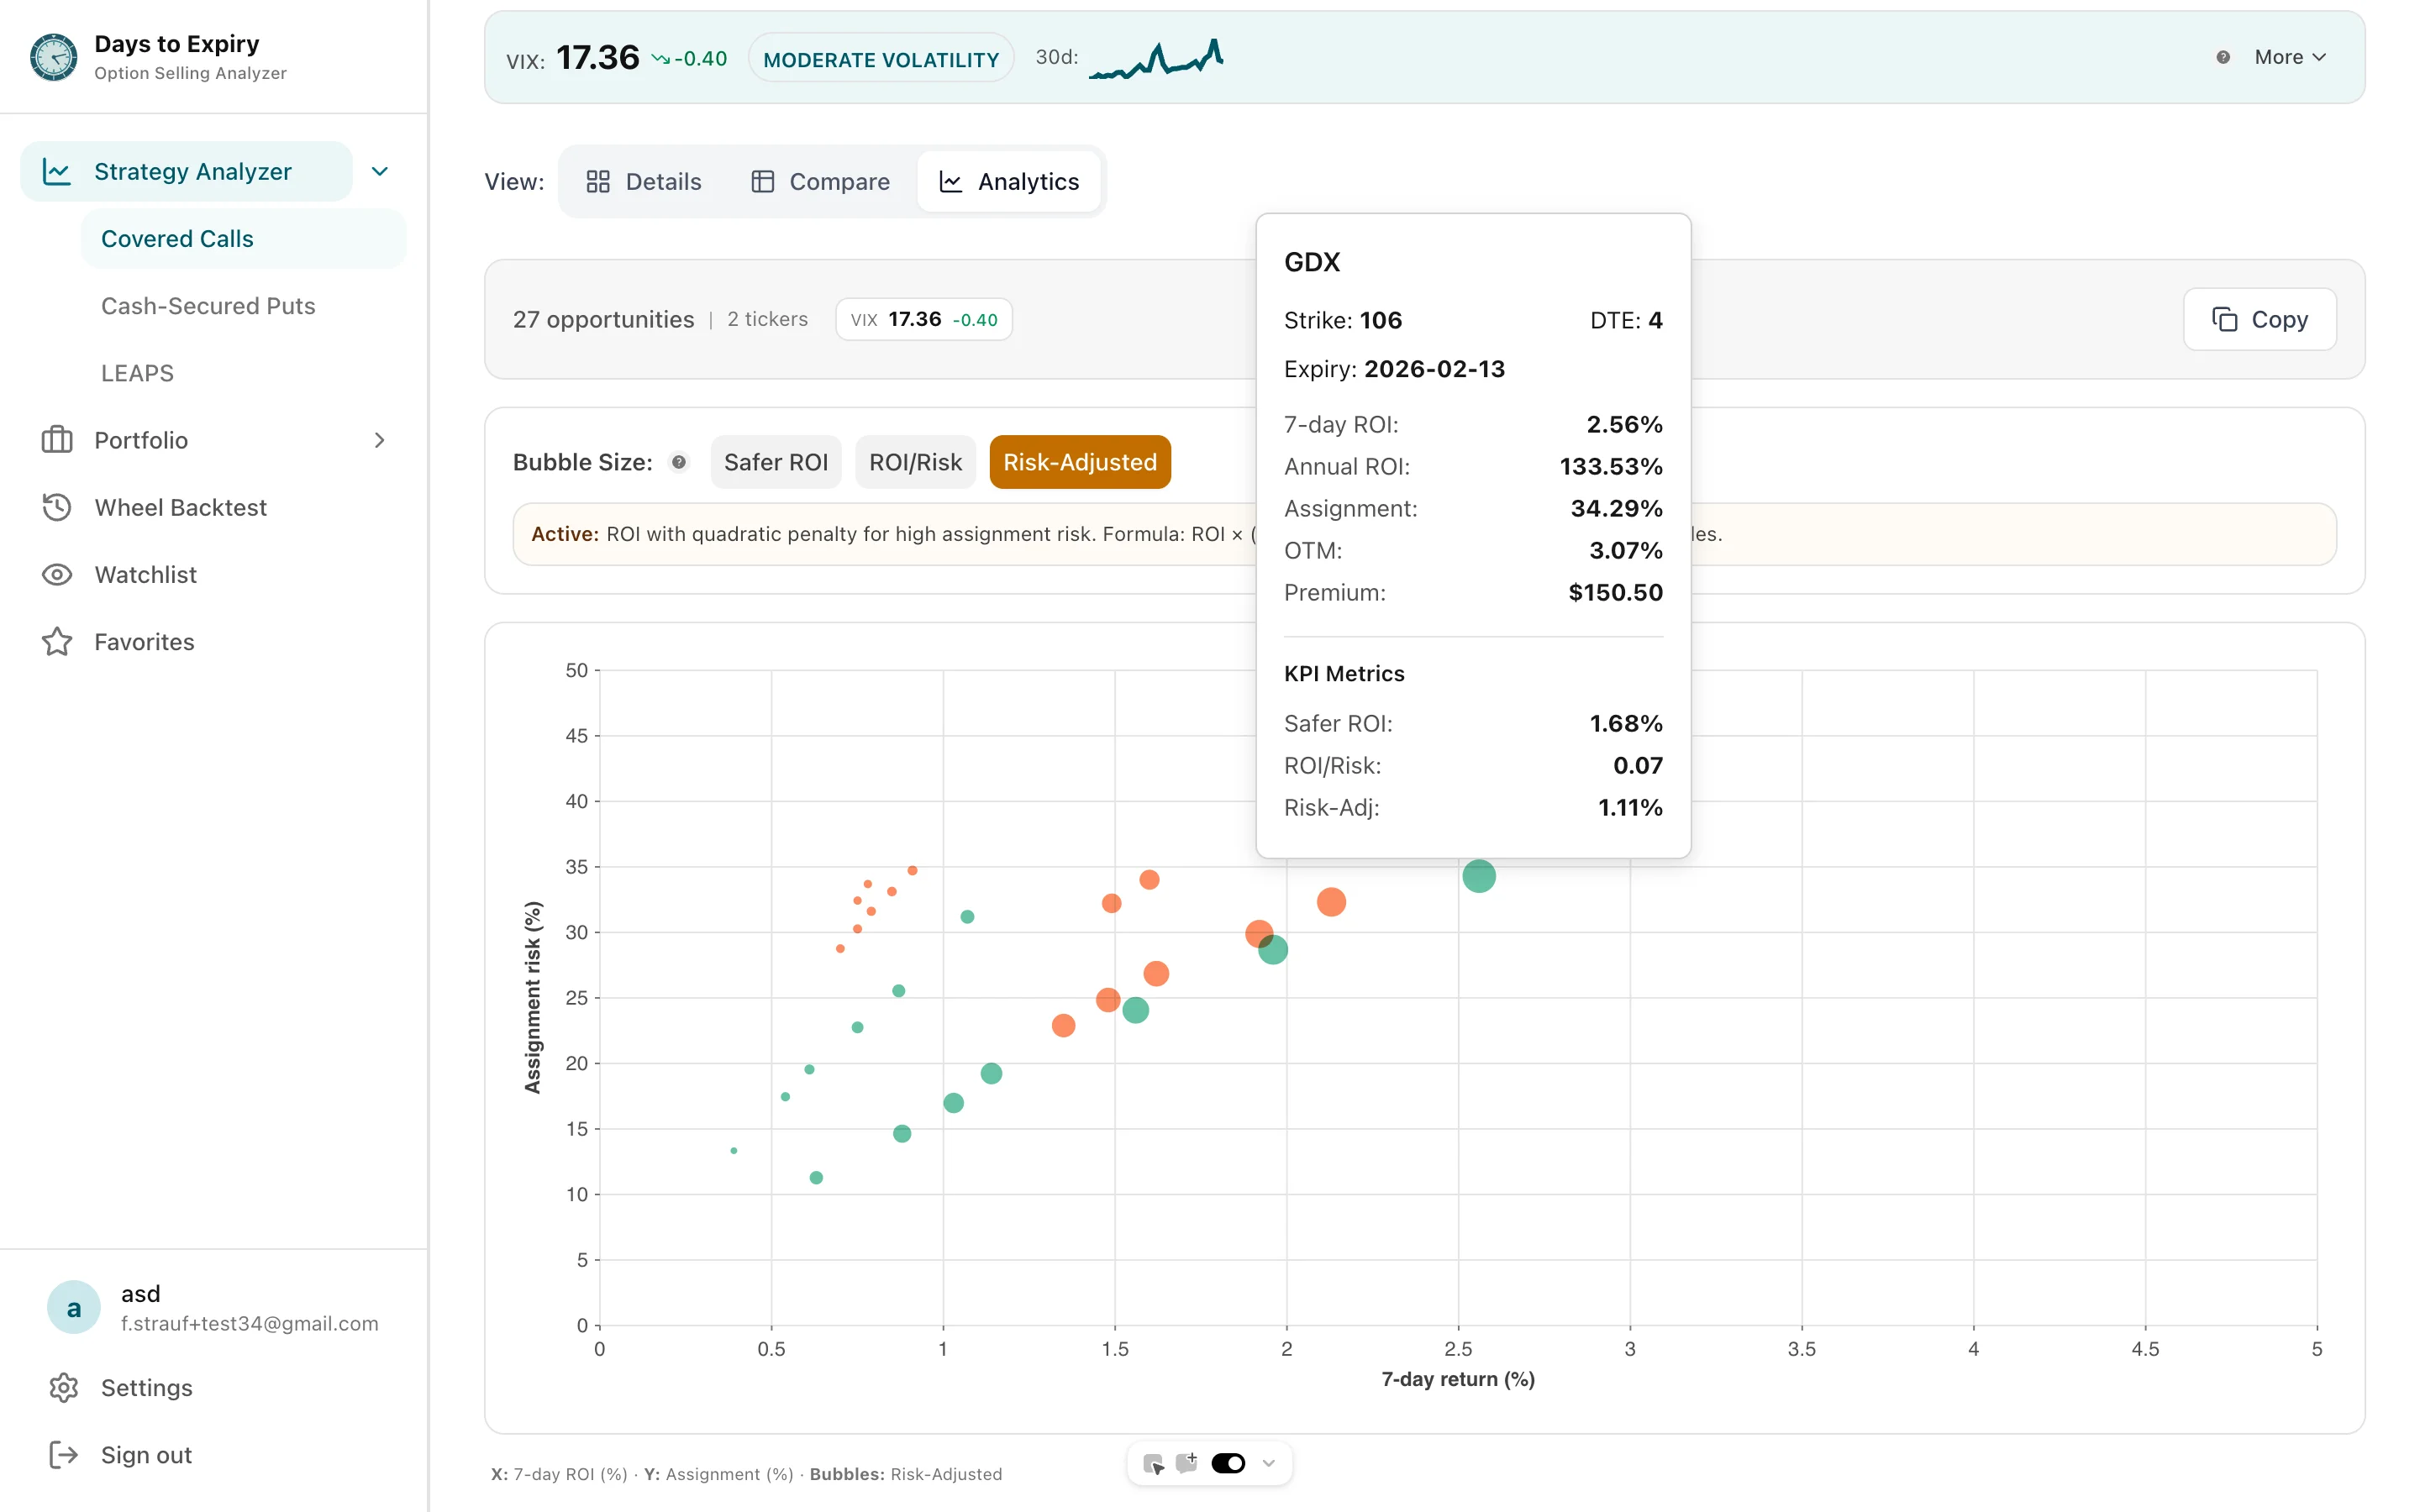
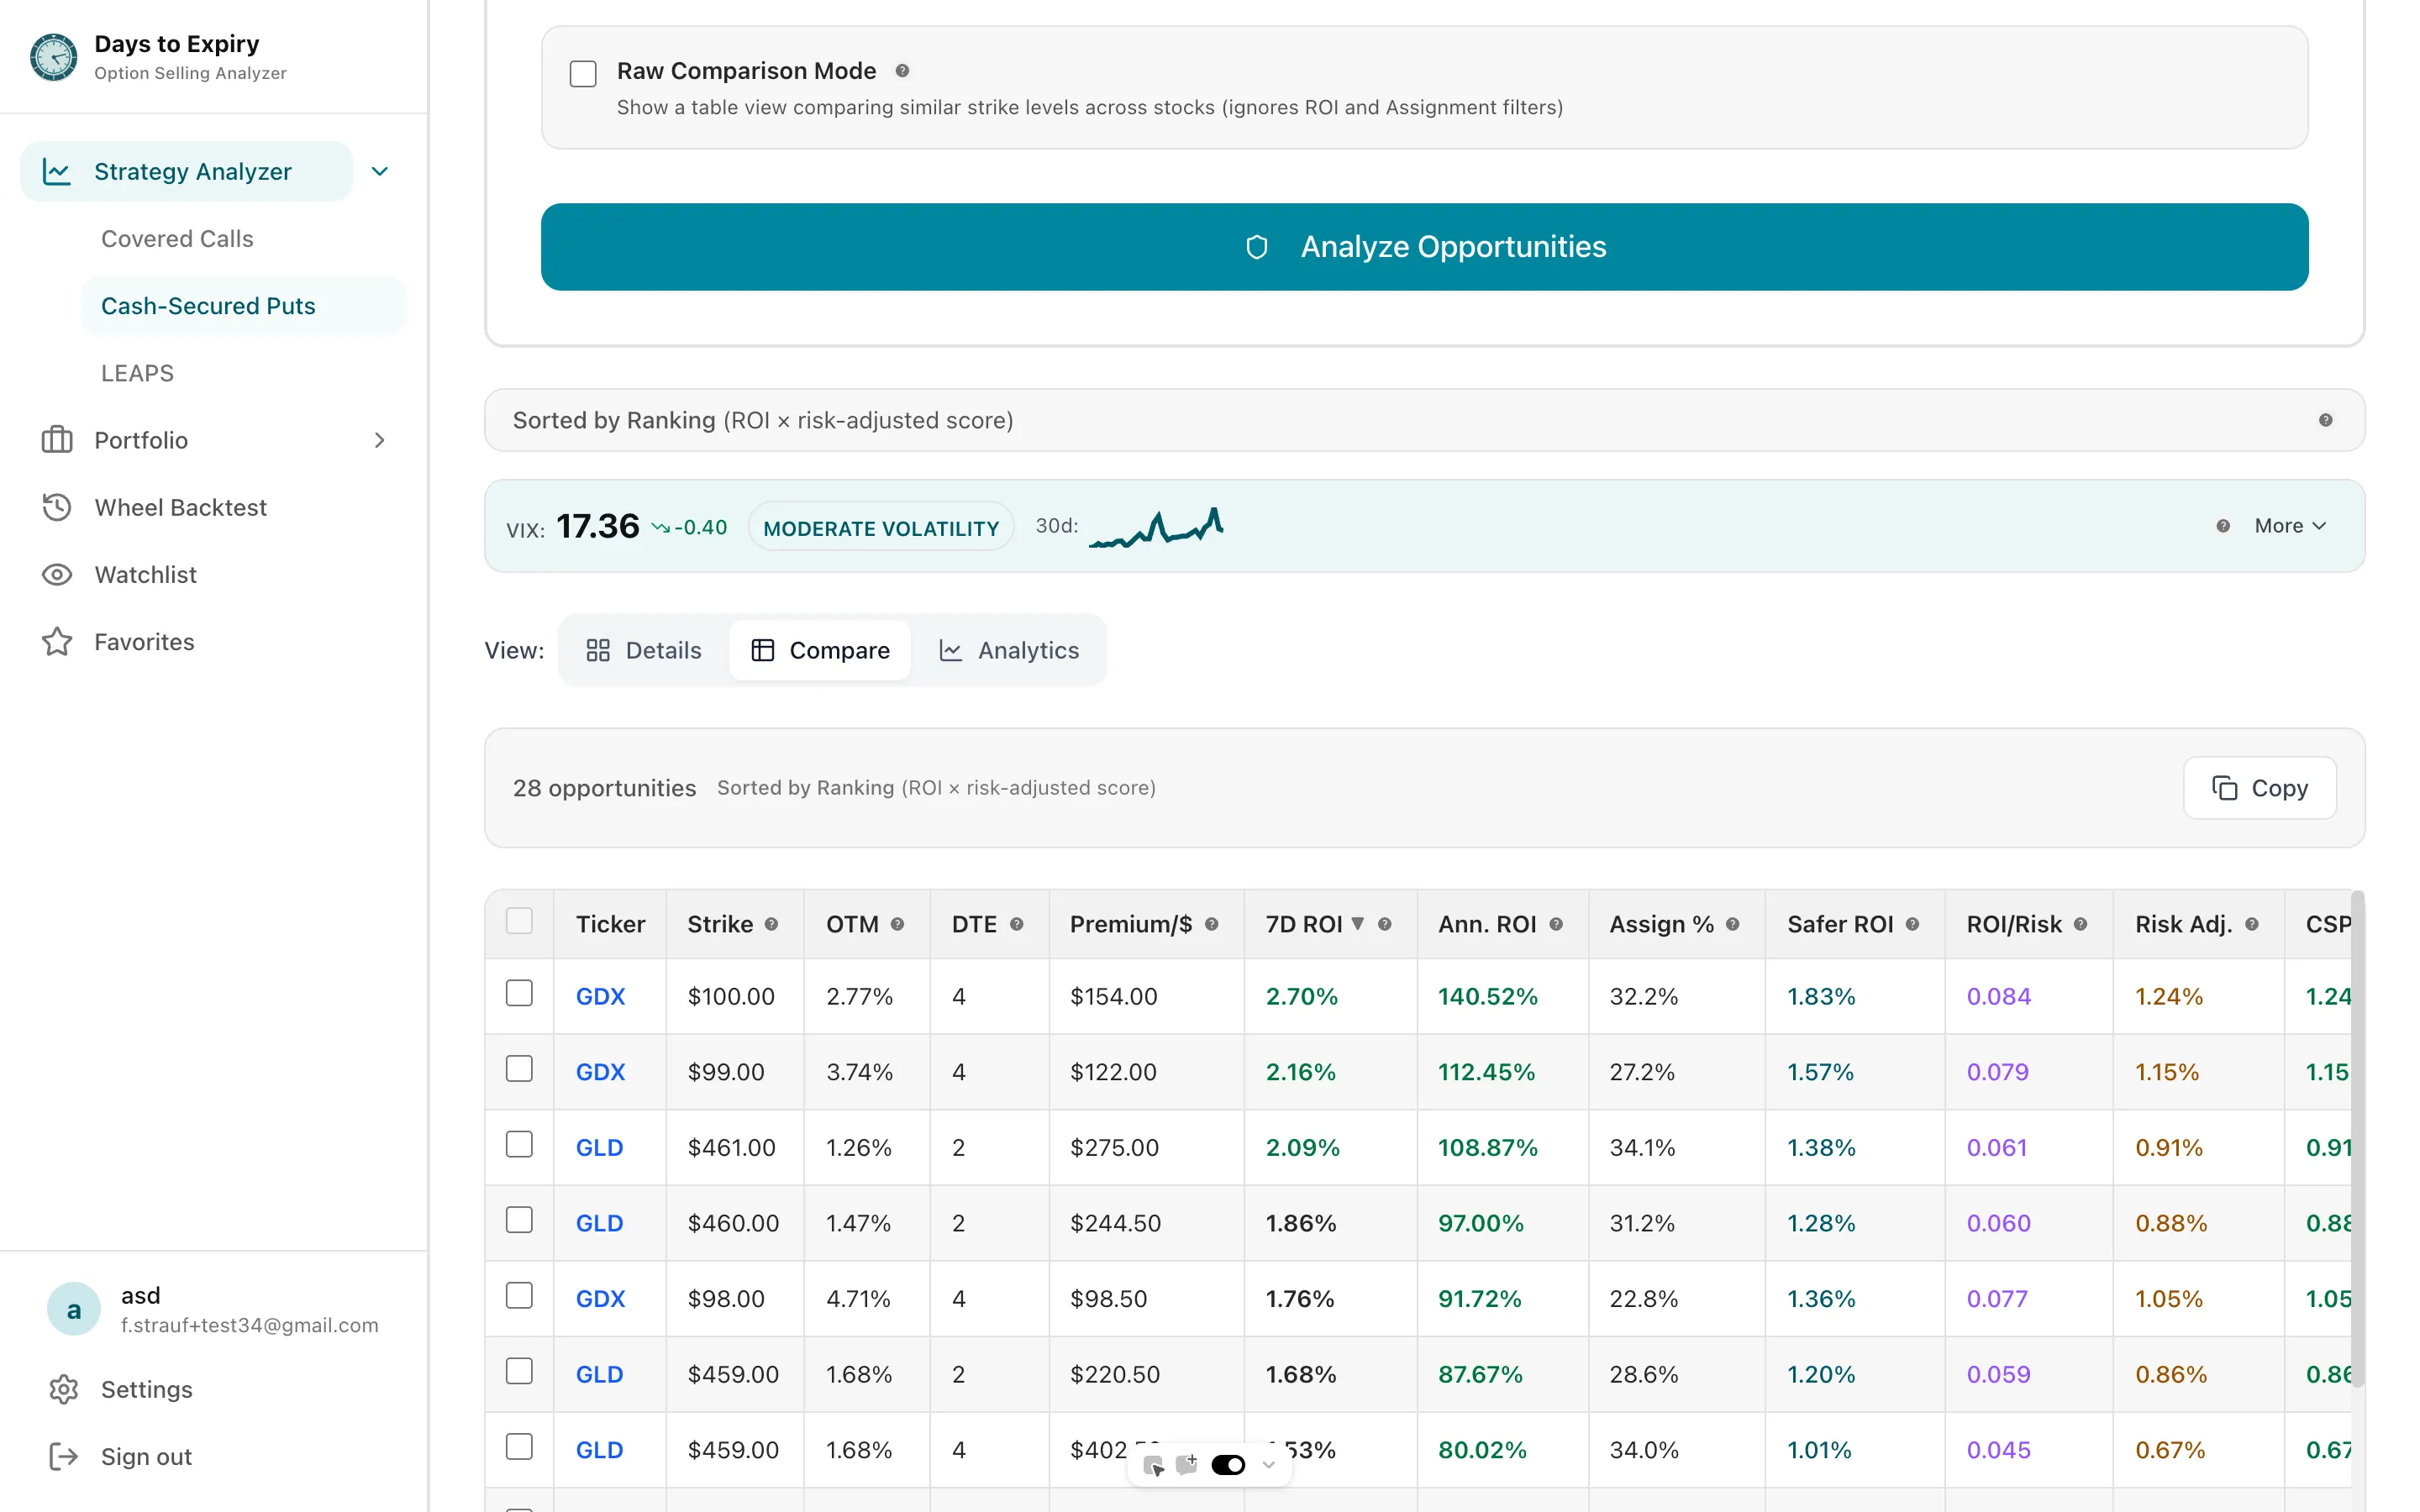
Assignment odds in plain language
ROI and DTE side-by-side
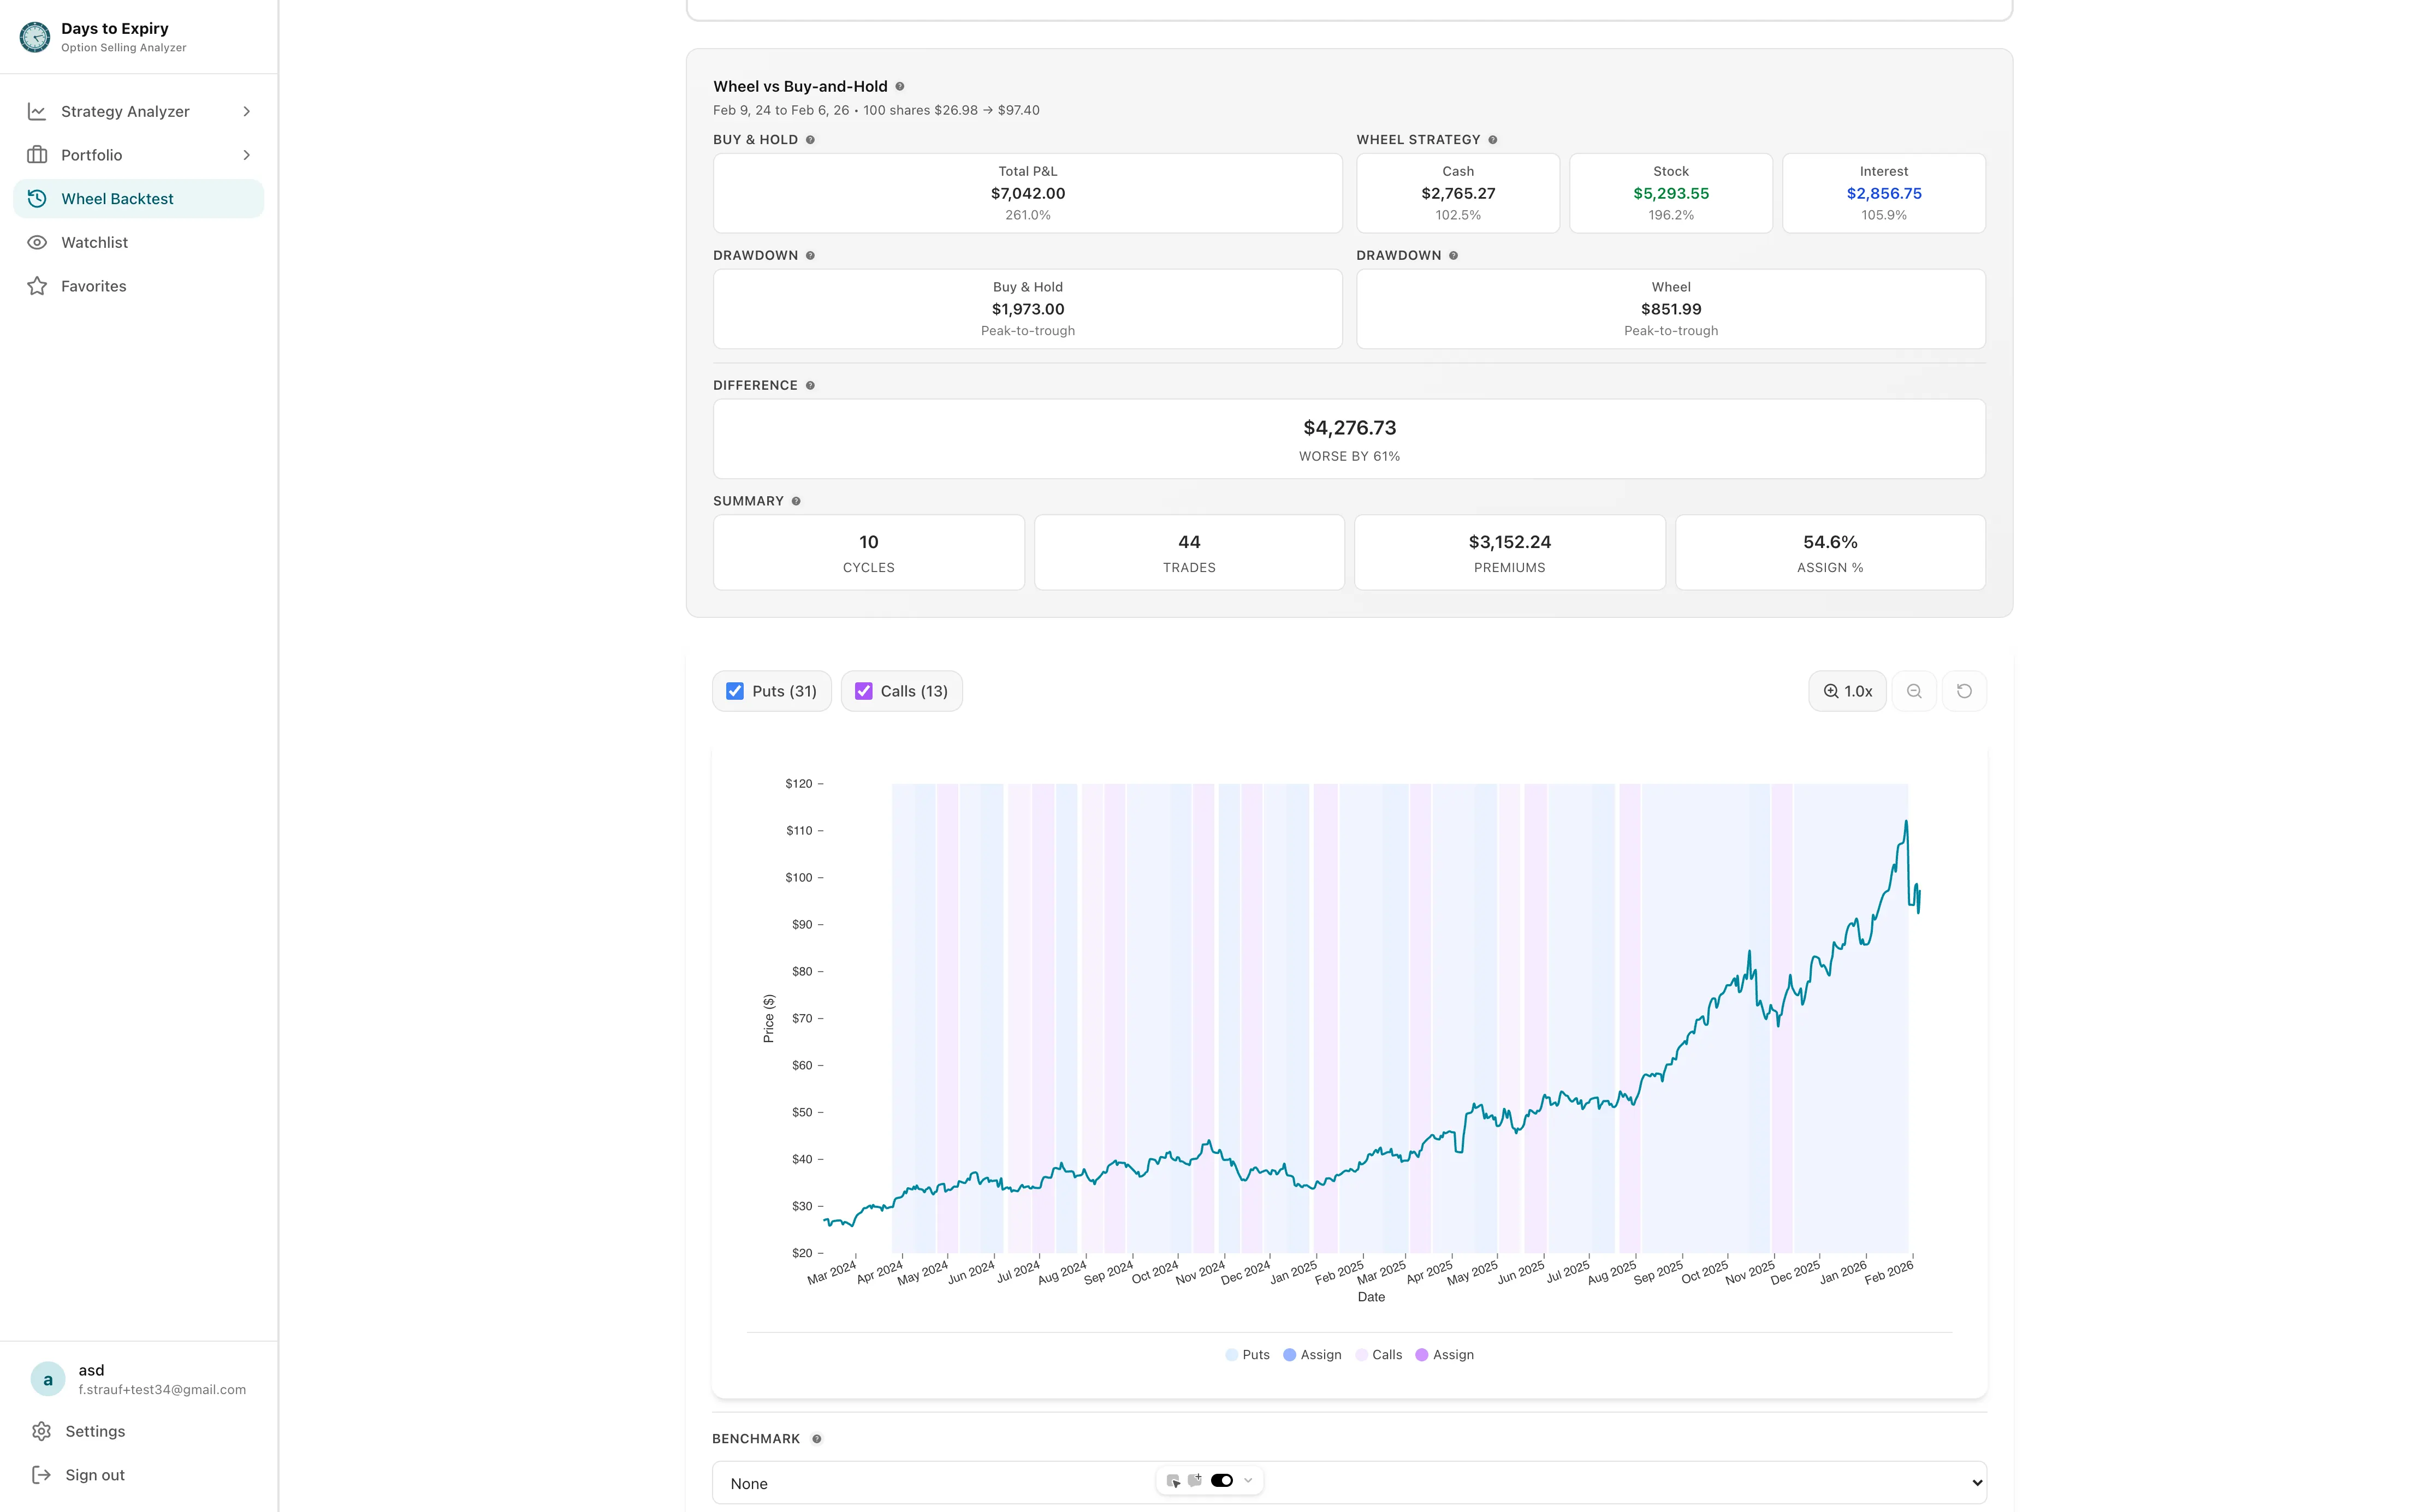
Backtests before trades
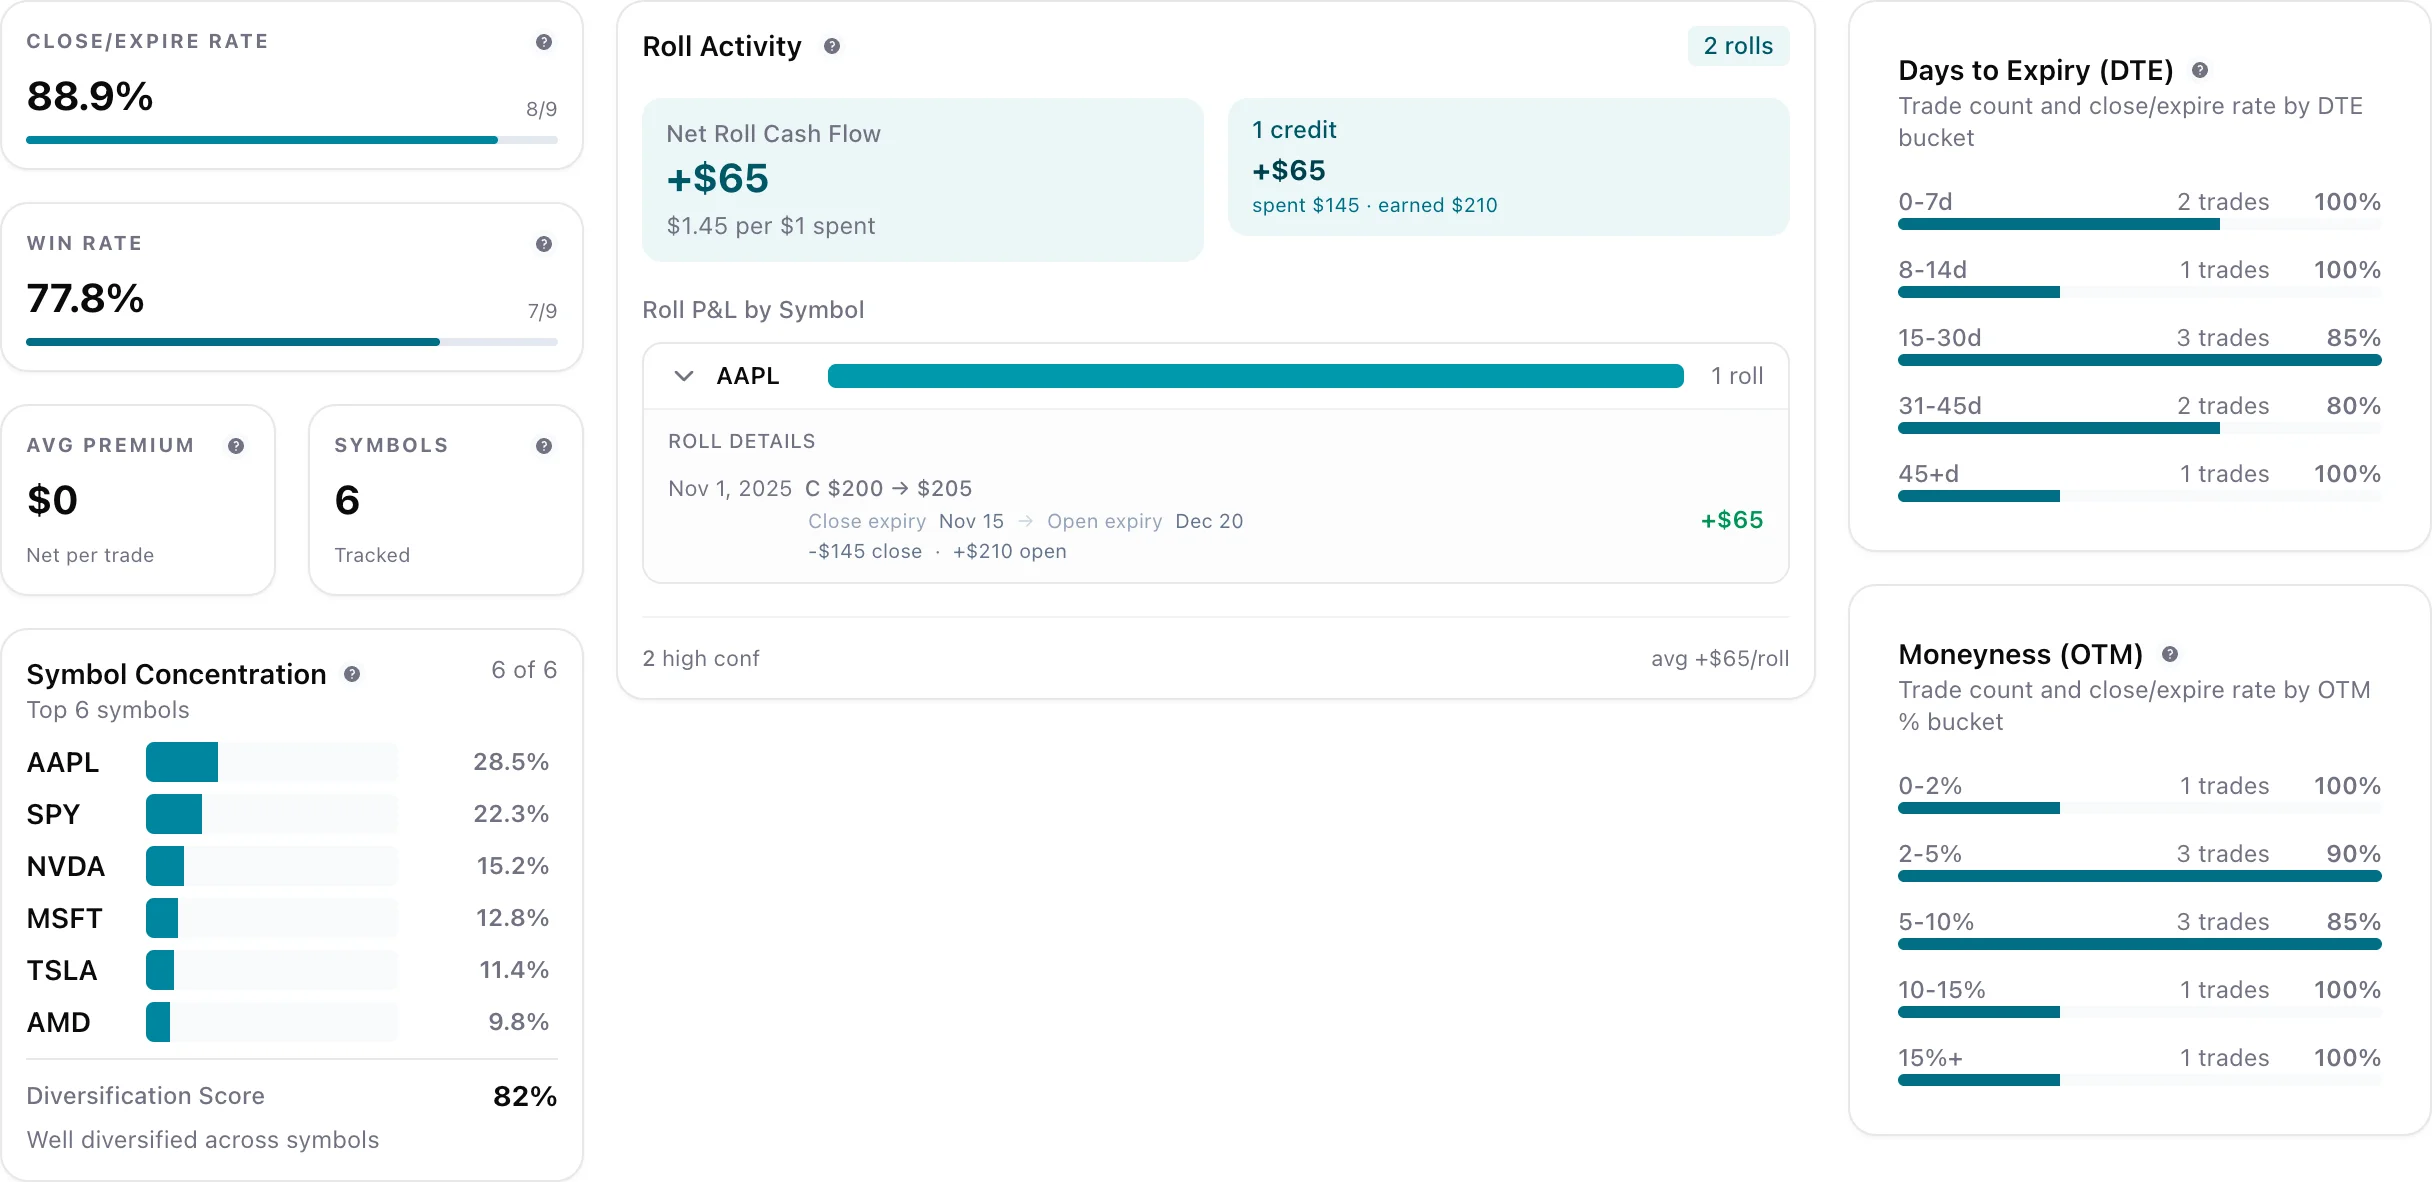
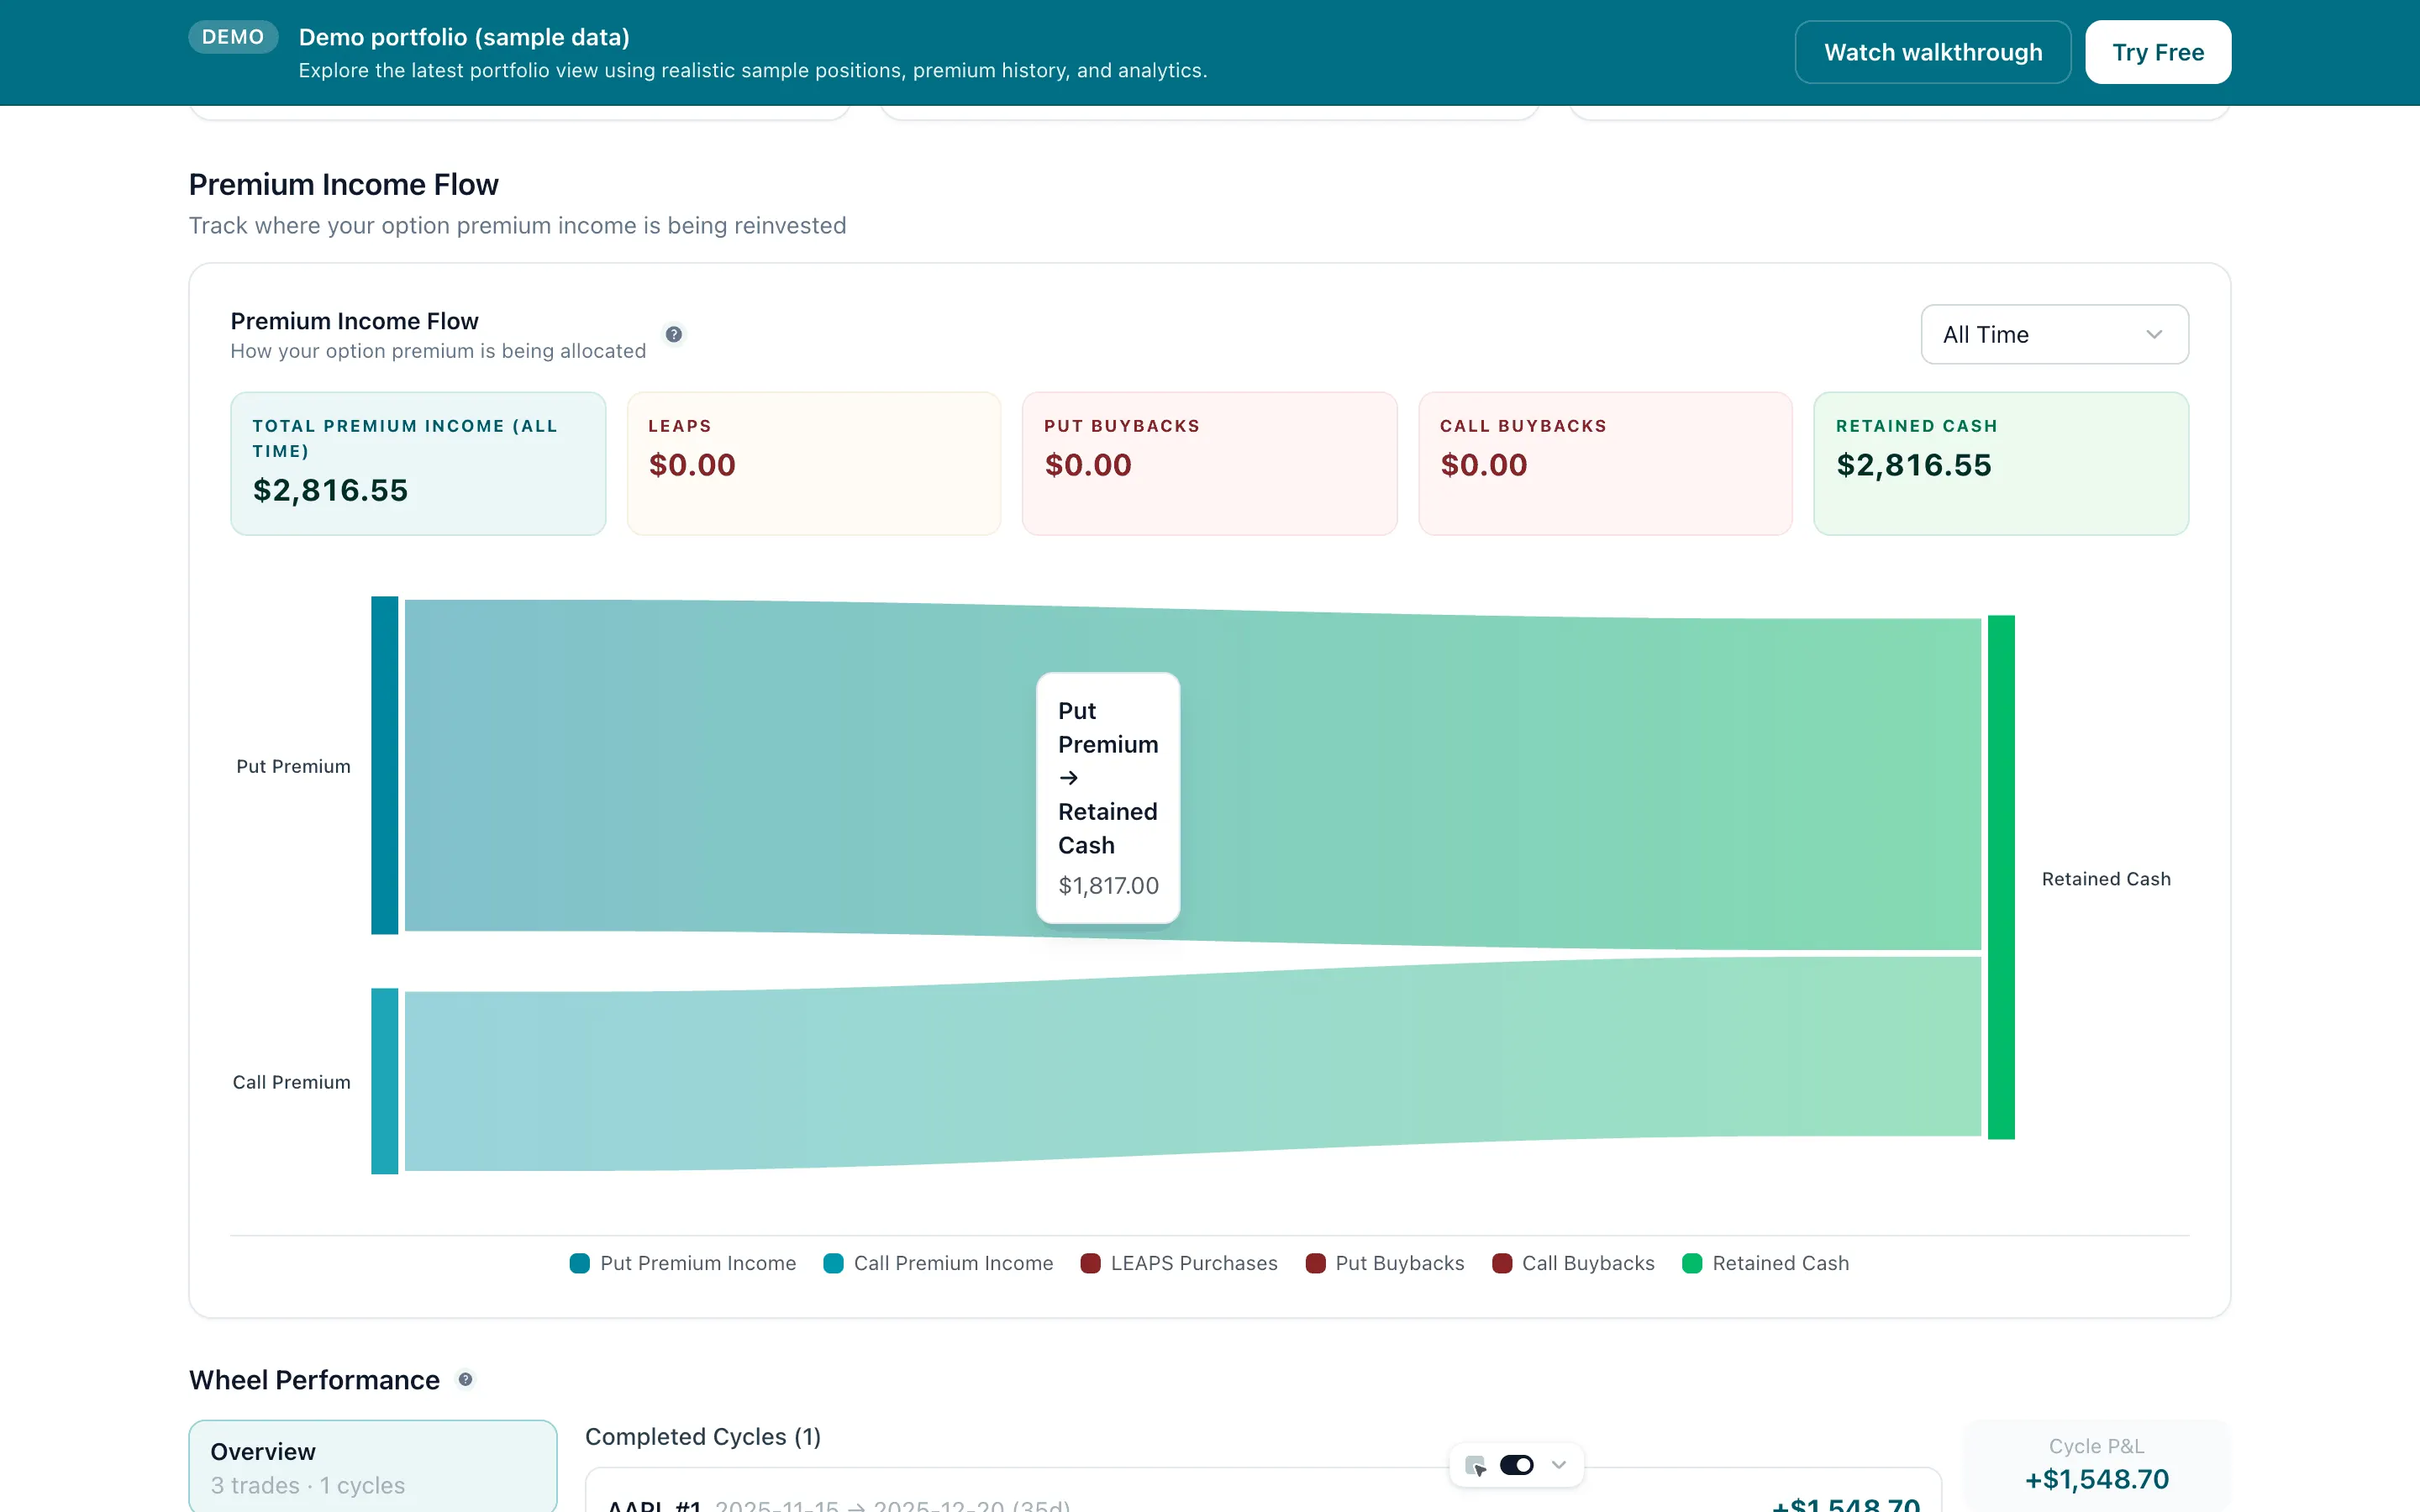
One place to track premium income
Enter your portfolio size and model a rough premium income estimate before you trade a single option.
Most investors start at 50%–70% and adjust from there.
Strategy posture
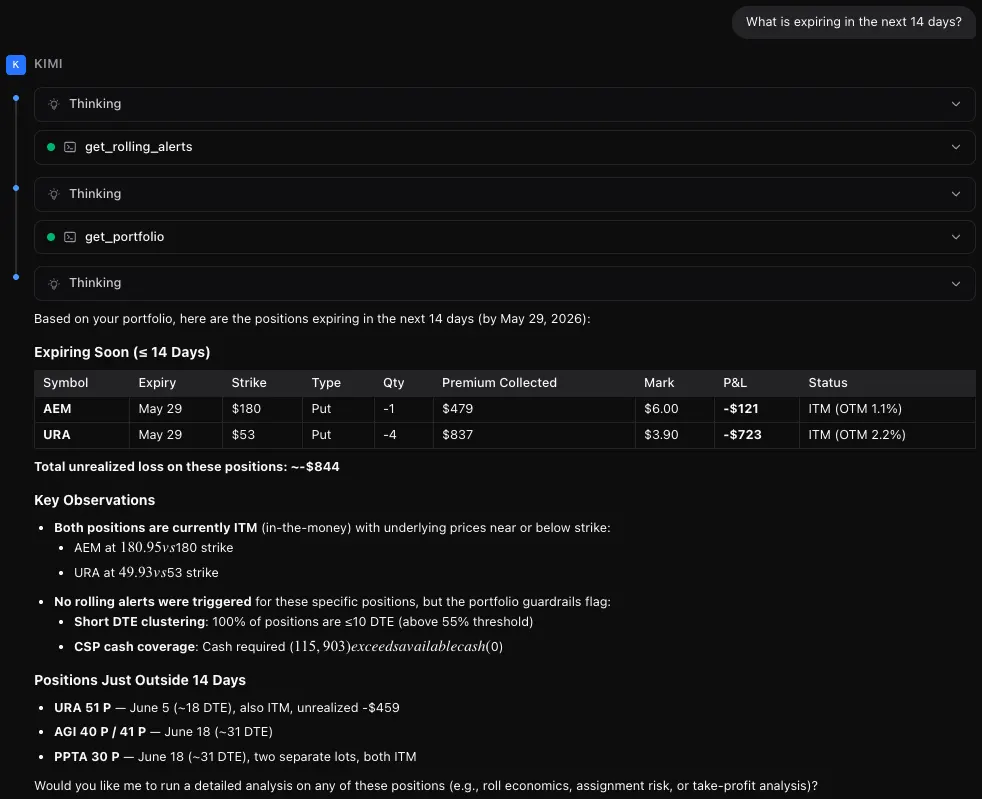
Stop copy-pasting into ChatGPT. Connect Days to Expiry directly to Claude, Cursor, or Windsurf and ask questions in plain English.
“What expires this week?” or “Find roll opportunities” backed by live IBKR data
Use the AI you already pay for. We just expose the data.
Scoped API keys. Your data never trains an AI model.
A quick walkthrough of the latest portfolio and strategy features
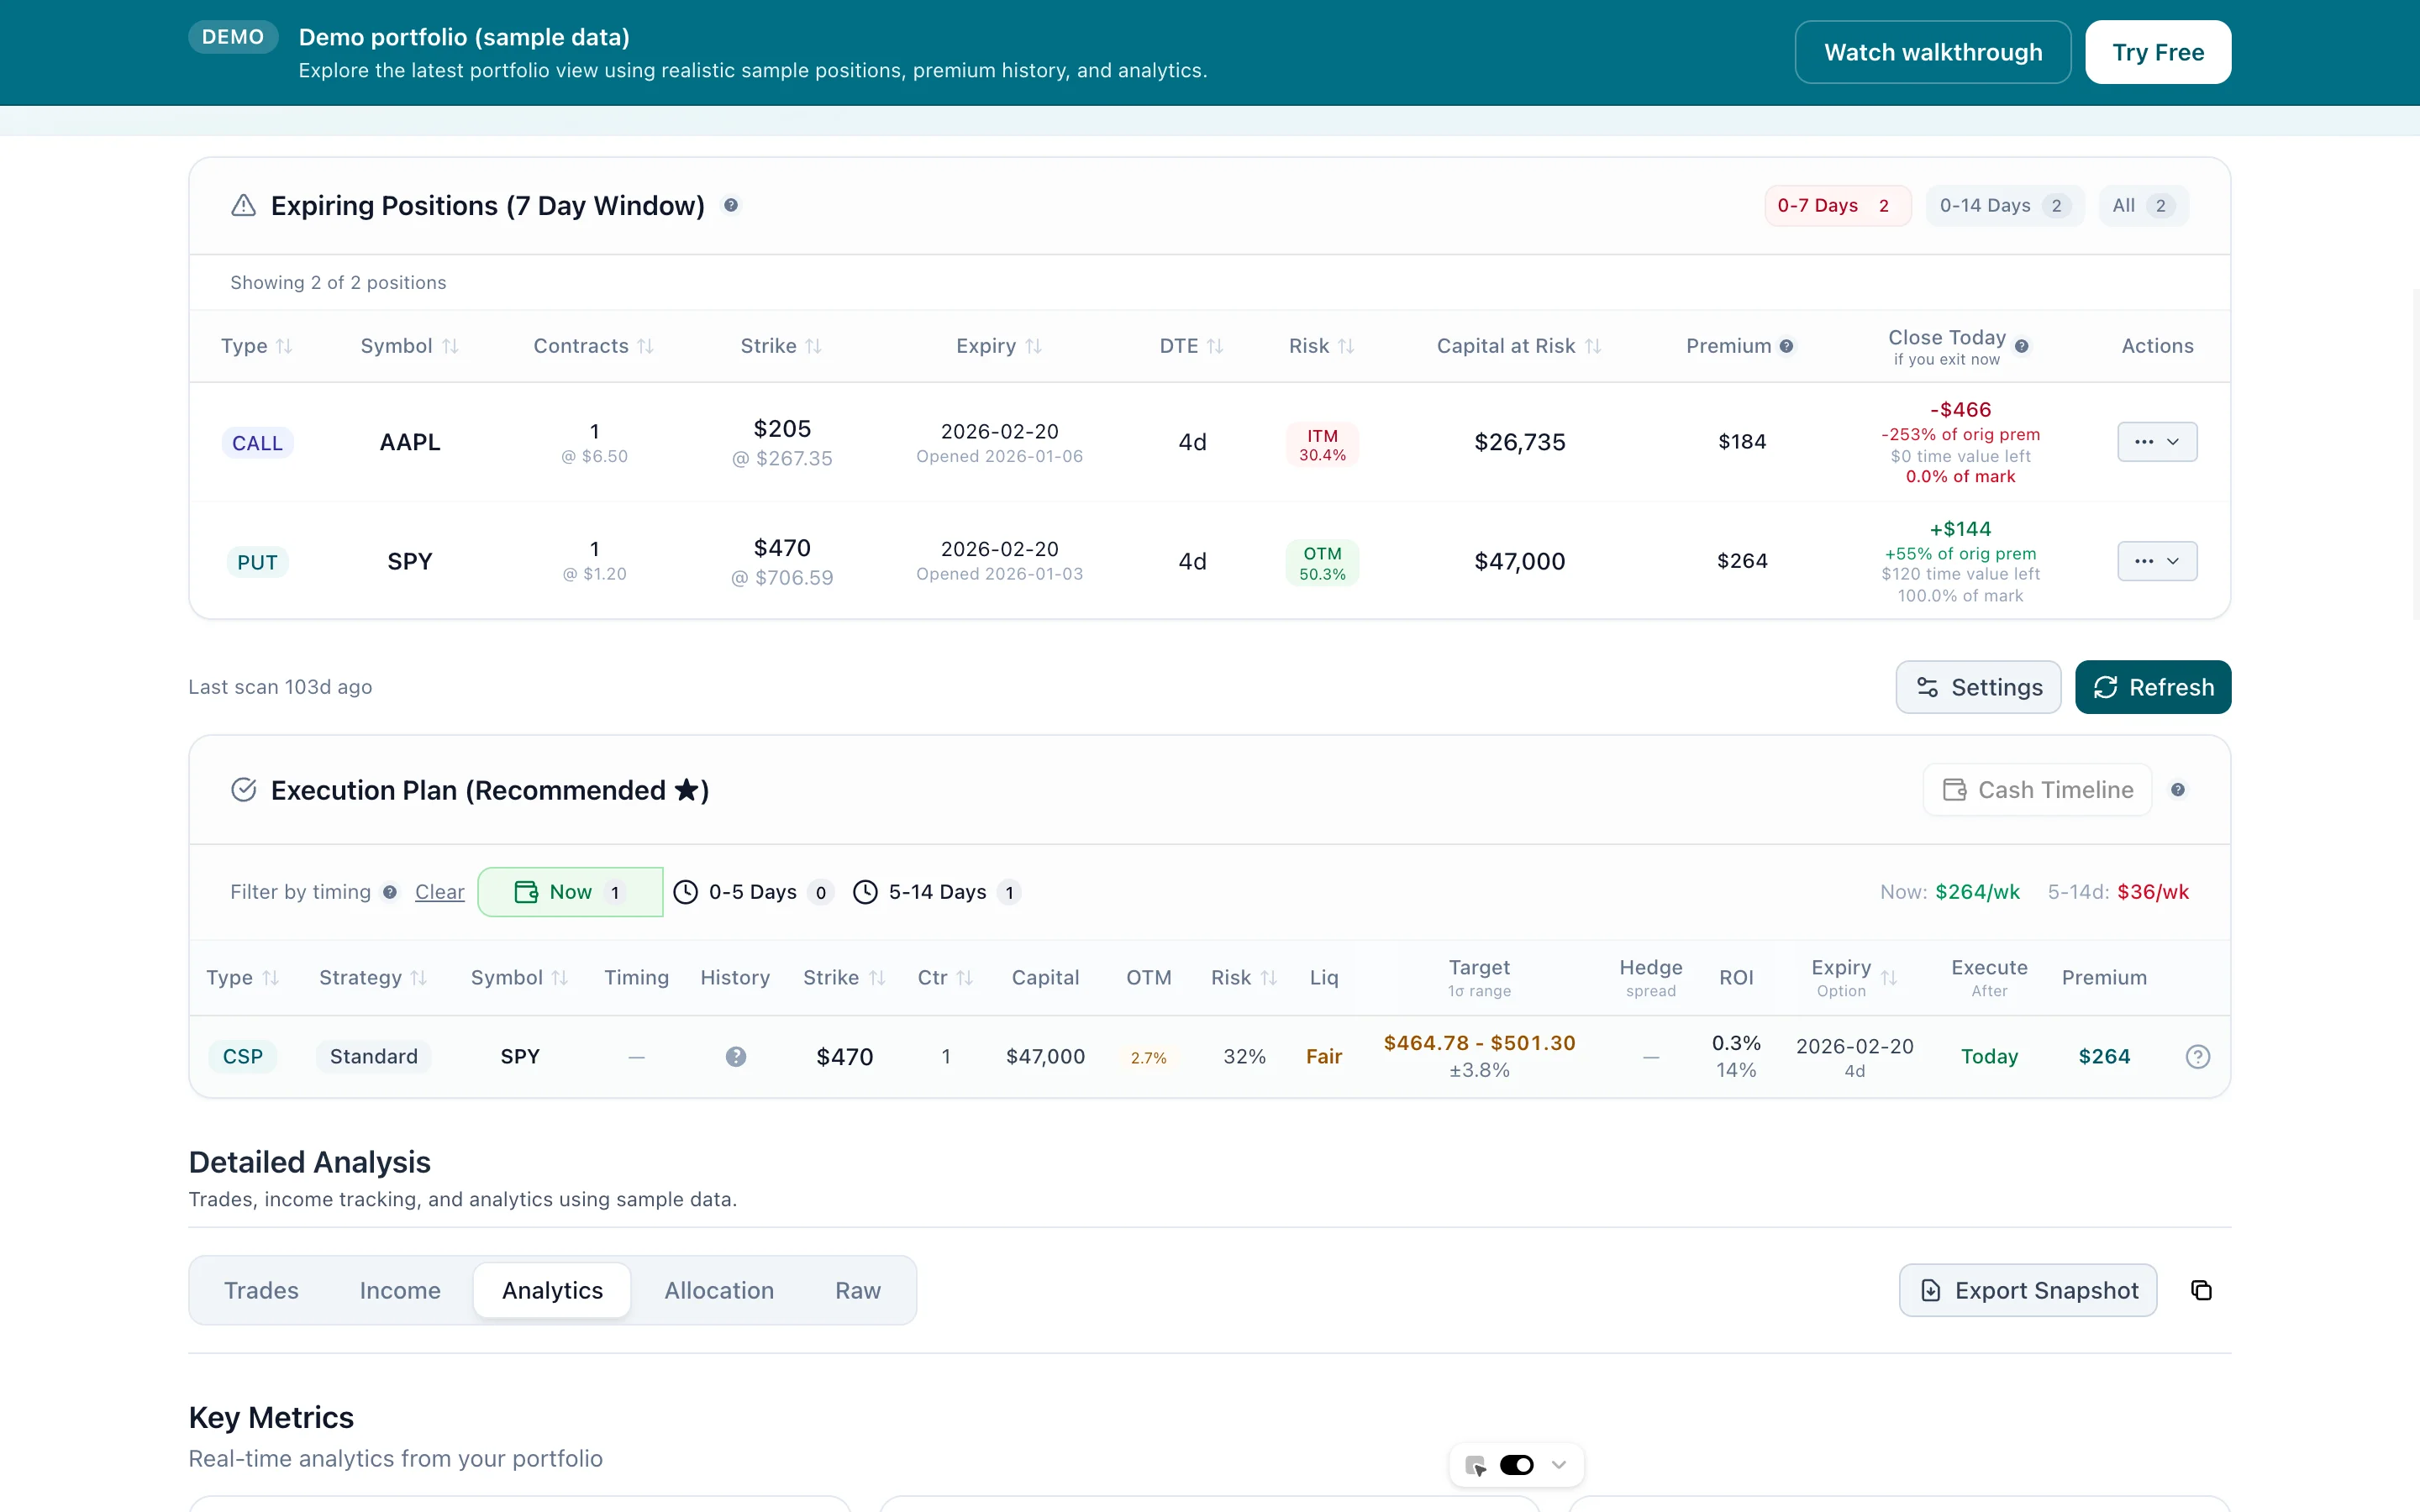
Review what is expiring, decide whether to hold, close, roll, or let assignment happen, then scan for the next opportunity.
General information only. Not financial advice.