Most income strategies are bullish. You're selling puts, hoping stocks don't drop. You're selling covered calls, hoping stocks don't rally too hard. Both require you to be long or neutral.
But what if you're bearish? What if you think a stock is overvalued and likely to pull back—but you don't want to buy expensive puts or short shares?
That's where call credit spreads come in. You're collecting premium by betting a stock won't rise above a certain level. If you're right, you keep the credit. If you're wrong, your loss is capped and defined.
This guide walks through call credit spreads from structure to execution, with DTE optimization strategies. You'll learn when to use call spreads instead of put spreads, how to structure positions for different market conditions, and how to combine them into iron condors for neutral income.
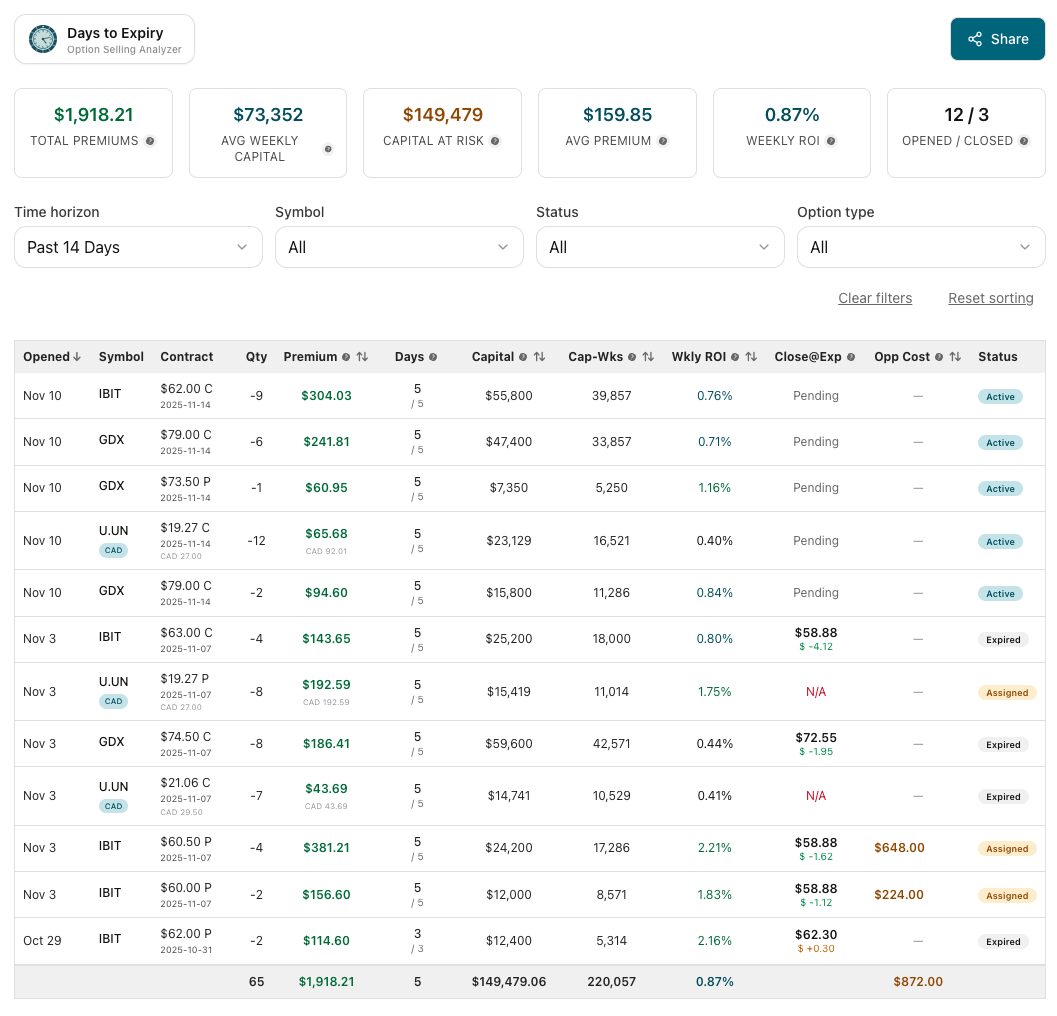
Build your spread legs: Use our Strategy Analyzer to analyze individual covered calls and find optimal short call strikes. Combine with a long call to create your defined-risk credit spread.
What is a Call Credit Spread?
A call credit spread is the mirror image of a put credit spread. Instead of selling puts (bullish), you're selling calls (bearish).
Structure:
- Leg 1: Sell a call at strike A (lower strike, closer to current price)
- Leg 2: Buy a call at strike B (higher strike, further from current price)
You collect net premium because you're selling a more expensive call (closer to the money) and buying a cheaper call (further out of the money).
Example:
- Stock trading at $100
- Sell $105 call for $1.50
- Buy $110 call for $0.50
- Net credit: $1.00 per spread ($100 per contract)
Your maximum profit is the credit received ($100). Your maximum loss is the width of the spread minus the credit: ($110 - $105) - $1.00 = $4.00 per spread ($400 per contract).
When You're Right
The stock stays below your short strike ($105). Both calls expire worthless. You keep the $100 credit.
Return on capital: $100 profit / $400 collateral = 25% return
When You're Wrong
The stock rallies above $110. You lose the full width minus credit = $400. But you knew this risk upfront—no surprises, no margin calls, no unlimited loss.
Call Credit Spread vs Put Credit Spread: Which to Use?
Both spreads work the same mechanically—you're selling premium with defined risk. The difference is directional bias.
Use Call Credit Spreads When:
1. You're bearish or neutral-to-bearish
- Stock has rallied too far, too fast
- Valuation looks stretched (high P/E, overbought technicals)
- Resistance level overhead that you don't think will break
Example: Stock rallied from $80 to $100 in 3 weeks. RSI = 78 (overbought). You think it'll consolidate or pull back. Sell $105/$110 call spread.
2. The stock is at resistance
- Stock has hit $105 three times in the past 6 months and pulled back each time
- You're betting it fails to break through again
3. Implied volatility is elevated and you expect IV crush
- Stock about to report earnings. IV is sky-high. You think earnings will be a "sell the news" event.
- Sell call spreads right before earnings, profit from IV crush + stock pullback
4. You want to bet against a specific price level without shorting
- Shorting stock = unlimited loss, margin requirements, dividend risk
- Call spread = defined loss, lower capital requirement, no dividend risk
Use Put Credit Spreads When:
1. You're bullish or neutral-to-bullish
- Stock pulled back to support
- You think it won't drop further
2. You want to own the stock eventually
- Put spreads don't lead to assignment (both legs cancel out)
- But they're still a bullish bet with defined risk
3. The stock is at support
- Stock has bounced off $95 multiple times
- You bet it holds again
Example Comparison
Scenario: Stock at $100. You're analyzing both sides.
| Spread Type | Strikes | Credit | Max Loss | Directional Bias | When to Use |
|---|---|---|---|---|---|
| Put Credit | Sell $95 / Buy $90 | $1.00 | $400 | Bullish | Stock at support, expect bounce |
| Call Credit | Sell $105 / Buy $110 | $1.00 | $400 | Bearish | Stock at resistance, expect pullback |
Same risk/reward profile. Opposite direction. Pick based on your market view.
How to Structure a Call Credit Spread
Building a call spread involves the same three decisions as put spreads: strike selection, width, and DTE.
Step 1: Choose Your Short Strike (The Sold Call)
This is where you're betting the stock won't go. It determines your probability of profit.
Guidelines:
- Conservative: 0.20-0.25 delta (15-20% probability stock finishes above this strike)
- Moderate: 0.30-0.35 delta (30-35% probability)
- Aggressive: 0.40-0.45 delta (40-45% probability)
Example (stock at $100):
- Conservative: Sell $108 call (0.20 delta) = 80% chance of profit
- Moderate: Sell $105 call (0.30 delta) = 70% chance of profit
- Aggressive: Sell $103 call (0.40 delta) = 60% chance of profit
The closer to current price, the more premium you collect—but the higher your assignment risk.
Most traders use 0.30 delta as the sweet spot.
Step 2: Choose Your Long Strike (The Bought Call)
This defines your maximum loss. The further away, the wider the spread, the more capital at risk.
Common widths:
- $5 wide: Standard for most stocks
- $10 wide: For expensive stocks (> $200)
- $2-3 wide: For cheap stocks (< $50)
Rule of thumb: Keep width ≤ 10% of stock price.
Example (stock at $100):
- Narrow: Sell $105, Buy $108 ($3 wide) = collect $0.60, risk $2.40
- Standard: Sell $105, Buy $110 ($5 wide) = collect $1.00, risk $4.00
- Wide: Sell $105, Buy $115 ($10 wide) = collect $1.80, risk $8.20
Narrower spreads have higher ROI but collect less absolute premium.
Step 3: Choose Your DTE
Same DTE principles as put spreads apply here. Let's optimize for call spreads specifically.
DTE Optimization for Call Credit Spreads
Short DTE (7-14 Days): Quick Bearish Plays
Why use it:
- Fast directional bet on a pullback
- High probability if stock is overbought
- Can capitalize on post-earnings IV crush
Setup:
- 10 DTE, sell 0.25 delta call (far OTM)
- $5 wide spread
- Collect $0.30-0.50
Example:
- Stock at $100 after rallying 15% in 2 weeks
- Sell $107 call / Buy $112 call (10 DTE)
- Collect $0.35 ($35)
- Risk $4.65 ($465)
- Return: 7.5% in 10 days if stock stays below $107
Advantages:
- Quick turnover
- Can time entries around technical resistance levels
- Lower gamma risk than long DTE near expiration
Disadvantages:
- Small premium per trade
- If stock has momentum, it can easily breach your strike
- More frequent management
Best for: Tactical bearish plays on overbought stocks or post-earnings fades.
Medium DTE (21-35 Days): Standard Bearish Income
Why use it:
- Best balance of premium and probability
- Capture peak theta decay
- Time for stock to consolidate or pull back
Setup:
- 30 DTE, sell 0.30 delta call
- $5 wide spread
- Collect $0.80-1.20
Example:
- Stock at $100, sitting at technical resistance
- Sell $105 call / Buy $110 call (30 DTE)
- Collect $1.00 ($100)
- Risk $4.00 ($400)
- Return: 25% in 30 days if stock stays below $105
Advantages:
- Meaningful premium collection
- More time for bearish thesis to play out
- Less management overhead
Disadvantages:
- Capital locked up for a month
- If stock breaks out strongly, harder to defend
Best for: Most traders. Default DTE for consistent bearish income.
Long DTE (45-60 Days): Patient Bearish Thesis
Why use it:
- Maximum premium upfront
- Most forgiving (stock can rally temporarily and still work out)
- Can close early at 50% profit
Setup:
- 60 DTE, sell 0.30-0.35 delta call
- $10 wide spread
- Collect $2.00-3.00
Example:
- Stock at $100 after extended rally
- Sell $105 call / Buy $115 call (60 DTE)
- Collect $2.50 ($250)
- Risk $7.50 ($750)
- Return: 33% over 60 days, or close early at 50% profit
Advantages:
- Big credit upfront
- Time for consolidation or reversal
- Can withstand temporary rallies
Disadvantages:
- Higher vega exposure (vulnerable to IV spikes if stock rallies)
- Capital tied up longer
- Slower theta decay initially
Best for: Longer-term bearish views or stocks in clear downtrends.
DTE Recommendation
Start with 30 DTE for call spreads, just like put spreads. It's the sweet spot for theta capture and probability of profit.
As you gain experience, mix strategies: 14 DTE for quick tactical plays, 45 DTE for higher-conviction bearish views.
Selecting Stocks for Call Credit Spreads
Not every stock is a good call spread candidate. You want specific setups:
Setup 1: Overbought After Strong Rally
What to look for:
- Stock up 10-20%+ in 1-3 weeks
- RSI > 70 (overbought)
- Trading at or near all-time highs with no clear catalyst
Why it works: Mean reversion. Stocks that rally hard tend to consolidate or pull back.
Example:
- Stock rallied from $80 to $100 in 2 weeks after earnings beat
- RSI = 75
- No major news ahead
- Sell $105/$110 call spread (30 DTE)
- Bet: Stock consolidates below $105 for next month
Setup 2: Failed Breakout
What to look for:
- Stock attempted to break resistance multiple times
- Each time, it failed and pulled back
- Volume declining on recent rally attempts
Why it works: Resistance levels are real. If a stock can't break through after 3-4 attempts, it's likely to fail again.
Example:
- Stock has hit $105 four times in past 6 months
- Each time, it reversed back to $95-100 range
- Currently at $102
- Sell $105/$110 call spread
- Bet: Fifth attempt fails too
Setup 3: Post-Earnings IV Crush (Bearish Variant)
What to look for:
- Stock has earnings in 1-2 days
- IV is elevated (60-80th percentile)
- You're bearish on the results or think good news is priced in
Why it works: Even if stock doesn't drop much, IV crush after earnings will collapse call premium.
Example:
- Stock at $100, earnings tomorrow
- IV = 65%
- Sell $105/$110 call spread (7 DTE, expires day after earnings)
- Even if stock goes to $103, IV drops from 65% to 35%, your spread profits from IV crush
Risk: If earnings are a blowout and stock gaps up 10%, you take max loss. Only do this if you have a strong bearish view.
Setup 4: Overvalued High-Flyers
What to look for:
- Stock trading at nosebleed valuations (P/E > 50, no earnings, meme stock)
- Parabolic chart (up 100%+ in 3 months)
- Reddit/social media hype reaching peak
Why it works: Gravity eventually wins. High-flyers crash hard when sentiment shifts.
Example:
- Meme stock at $150, up 200% in 2 months
- No fundamental justification
- Sell $160/$170 call spread (45 DTE)
- Bet: Momentum fades, stock consolidates or drops
Risk: Momentum can last longer than you expect. Only allocate 5-10% of portfolio to these "fade the hype" plays.
Managing Call Credit Spreads
Scenario 1: Stock Stays Below Short Strike (Winning Trade)
Example: Sold $105/$110 call spread. Stock at $102 with 7 days left.
Your options:
Option A: Hold to expiration
- Let both calls expire worthless
- Collect full credit
- Risk: If stock gaps up on news, you could still lose
Option B: Close at 50-70% profit
- Spread now worth $0.30 (you sold for $1.00)
- Close for $0.70 profit, redeploy capital
- Smart move if you've captured 70% of profit in 50% of time
Best practice: Close at 50% profit if it happens in < 21 days. Don't grind for the last 30%.
Scenario 2: Stock Rallies Above Short Strike (Losing Trade)
Example: Sold $105/$110 call spread. Stock rallied to $107 with 10 days left.
Your options:
Option A: Hold and hope for pullback
- Stock could reverse below $105
- But if it doesn't, you're taking max loss
Option B: Close early for partial loss
- Spread now worth $2.50 (you sold for $1.00)
- Down $1.50 = $150 loss
- Cut the loss, move on
Option C: Roll up and out
- Close $105/$110 spread (take the loss)
- Open new $110/$115 spread (30 DTE) for $1.20 credit
- Gives you more room and time
- Caution: Only if you still believe stock will stall
Best practice: Use the 50% loss rule. If spread is down 50% of max loss, close it. Don't hope for miracles.
Scenario 3: Stock Rallies Hard (Max Loss Territory)
Example: Sold $105/$110 call spread. Stock gapped to $115 on blowout earnings.
Your spread is worth $5.00 (max loss). You're down $400.
Your only option: Accept the loss.
Close the spread. Take the $400 hit. Move on.
Don't: Roll it into an even higher strike hoping for a reversal. That's how accounts blow up.
Learn: What went wrong? Did you sell into a catalyst (earnings)? Was the stock stronger than you thought? Adjust your strategy for next time.
Call Credit Spreads vs Naked Call Selling: Why Spreads Win
Some traders sell naked calls to collect more premium. Bad idea for most retail traders.
Naked Call Selling
Structure: Sell $105 call on $100 stock, collect $1.50
Pros:
- Collect full premium ($150 vs $100 for spread)
- No long leg to pay for
Cons:
- Unlimited loss potential (if stock goes to $200, you lose $9,500)
- Massive margin requirements (broker requires 20-30% of stock value as collateral)
- Assignment risk (you'll be short shares if exercised)
- Not allowed in IRA accounts (most brokers)
Call Credit Spread
Structure: Sell $105 call, buy $110 call, collect $1.00
Pros:
- Defined max loss ($400, known upfront)
- Lower margin requirements ($400 vs $2,000-3,000 for naked)
- Allowed in IRA accounts
- No short stock assignment (both legs offset)
Cons:
- Collect less premium ($100 vs $150)
Verdict: For 99% of traders, spreads are the better choice. The reduced premium is a small price to pay for capped risk and lower capital requirements.
Only sell naked calls if:
- You have a margin account with $100k+
- You're comfortable with unlimited loss potential
- You're hedging an existing long position (covered calls)
Combining Call and Put Spreads: Iron Condors
Once you understand both call and put credit spreads, the natural progression is combining them: the iron condor.
Structure:
- Sell put spread below current price (bullish side)
- Sell call spread above current price (bearish side)
- Collect credit on both
Example (stock at $100):
- Sell $95/$90 put spread for $1.00
- Sell $105/$110 call spread for $1.00
- Total credit: $2.00 ($200)
- Max loss: $5 (width) - $2 (credit) = $3 per side = $300 total
Your bet: Stock stays between $95 and $105 for the next 30 days.
Why it works:
- You're collecting premium on both sides
- In range-bound markets, both spreads expire worthless
- Return: $200 / $300 risk = 66% if stock stays in range
When to use:
- Low volatility environments (VIX < 20)
- Stock has been range-bound for weeks
- After a big move (rally or selloff) when you expect consolidation
Risk:
- If stock breaks out in either direction, one side loses
- Max loss is limited to one side (the other side is profitable)
We'll cover iron condors in detail in a future guide, but this is the natural evolution of credit spreads.
Real-World Example: 2-Month Call Spread Campaign
Let's walk through a 2-month campaign running call credit spreads.
Starting capital: $5,000 allocated to call spreads
Strategy: 30 DTE, 0.30 delta, $5 wide spreads, close at 50% profit or max 21 DTE
Week 1: Opening Positions
- Position 1: NVDA rallied from $420 to $460 in 3 weeks. Sell $470/$475 for $1.10. Risk: $390.
- Position 2: TSLA at $250, hit $255 resistance 3 times. Sell $255/$260 for $0.90. Risk: $410.
- Position 3: AMD at $135, RSI = 72. Sell $140/$145 for $1.00. Risk: $400.
Total credits: $300
Total capital deployed: $1,200
Week 3: First Exits
- NVDA: Stock pulled back to $455. Spread worth $0.50. Close for $0.60 profit (55% of max).
- TSLA: Still at $250. Holding.
- AMD: Stock dropped to $130. Spread worth $0.20. Close for $0.80 profit (80% of max).
Profits so far: $140
Week 5: More Management
- TSLA: Stock at $248 with 7 days left. Spread worth $0.30. Close for $0.60 profit (67% of max).
New positions opened:
- AAPL: At $180, sell $185/$190 for $1.10 (30 DTE)
- MSFT: At $360, sell $370/$375 for $1.00 (30 DTE)
Week 7: Month 2 Results
- AAPL: Stock at $182. Close at 50% profit = $0.55.
- MSFT: Stock rallied to $368. Roll to $375/$380 for $0.90, net loss $0.10 but extended position.
End of 2 Months
Total Trades: 6
Winners: 5
Partial losses/rolls: 1
Total profit: $140 + $60 + $55 = $255 on $1,200 deployed = 21% return in 2 months
Annualized: ~126%
Win rate: 83%
Common Call Credit Spread Mistakes
Mistake 1: Fighting Strong Momentum
Stock is up 30% in a month with strong volume and news catalysts. You sell call spreads betting on a pullback. Stock keeps rallying. You lose.
Fix: Don't fight the tape. Only sell call spreads when momentum is slowing (declining volume, overbought technicals, resistance overhead).
Mistake 2: Selling Into Catalysts
Stock has earnings, FDA approval, or product launch in 5 days. You sell call spreads. News is positive. Stock gaps up 15%. Max loss.
Fix: Check the calendar. Avoid expirations that overlap with major catalysts unless you're specifically playing IV crush.
Mistake 3: Ignoring Vega Risk
You sell call spreads when IV is low (20th percentile). Stock rallies 3% and IV spikes. Even though stock is still below your short strike, spread is now worth more due to IV expansion. You're underwater.
Fix: Only sell call spreads when IV percentile > 50%. You want IV to work in your favor (compress as stock consolidates).
Mistake 4: Too Narrow Strikes
You sell $105 call on a $100 stock with $108 long call ($3 wide). Stock rallies to $106. You're near max loss despite stock only moving 6%.
Fix: Use $5-10 wide spreads. Give yourself breathing room. $3 wide spreads are too tight unless you're very confident.
Mistake 5: Holding Losers Too Long
Stock rallied past your short strike. You're down 60% of max loss. You hold, hoping for a reversal. It doesn't come. Max loss.
Fix: Cut losses at 50% of max loss. Redeploy capital to better opportunities.
When Call Spreads Beat Put Spreads
Both strategies have the same ROI mechanics. The question is: which fits the market environment?
Use Call Credit Spreads When:
- Market is topping – Indices overbought, sentiment euphoric
- Stock-specific resistance – Clear technical ceiling
- Post-earnings fade setup – Good news priced in
- Valuation extreme – Meme stocks, parabolic charts
- You're bearish but don't want to short – Defined risk preferred
Use Put Credit Spreads When:
- Market is bottoming – Oversold conditions, panic selling
- Stock at support – Clear technical floor
- Post-selloff recovery setup – Bad news overdone
- Value opportunity – Quality stock pulled back on no news
- You're bullish but don't want to buy shares – Leverage preferred
Use Both (Iron Condor) When:
- Range-bound market – Choppy, no clear direction
- Low volatility – VIX < 20, stocks consolidating
- Post-big-move consolidation – After 10%+ rally or selloff
- Earnings IV crush – Play both sides of the fade
Advanced: Ratio Call Spreads
Once you master standard call spreads, you can explore ratio spreads for higher income.
Structure:
- Sell 2x $105 calls
- Buy 1x $110 call
- Net credit: Higher than standard spread
Example:
- Stock at $100
- Sell 2x $105 calls for $1.50 each = $300
- Buy 1x $110 call for $0.50 = $50
- Net credit: $2.50 ($250)
Risk:
- If stock stays below $105: Win $250 (full credit)
- If stock goes to $105-110: Partial profit
- If stock goes above $110: Unlimited loss on the uncovered call
Caution: Ratio spreads introduce naked call risk on the extra short call. Only use if you're experienced and have a stop-loss plan.
Better for most traders: Stick with 1:1 spreads (balanced call credit spreads).
Final Thoughts: Call Spreads as Bearish Income
Call credit spreads give you a way to profit from bearish views without the risk of shorting stock or buying expensive puts.
They're perfect for:
- Tactical plays on overbought stocks
- Fading rallies at resistance
- Playing post-earnings IV crush from the bearish side
- Protecting a portfolio in a topping market
Key principles:
- Sell 30 DTE as default (optimal theta/probability balance)
- Use 0.30 delta strikes (70% win rate)
- Keep spreads $5-10 wide (manageable risk/reward)
- Only sell when IV percentile > 50% (get paid for risk)
- Close at 50% profit (don't grind for last 30%)
- Cut losses at 50% max loss (protect capital)
Start with 2-3 call spreads on different stocks. Run them for 2-3 months. Track your win rate and ROI. Combine with put spreads for a complete income toolkit.
This is how you profit whether the market goes up, down, or sideways. That's the power of credit spreads. That's directional flexibility with defined risk.
To understand the Greek mechanics driving call spreads, read our options Greeks guide. For the bullish counterpart, see put credit spreads. To combine both into neutral income strategies, explore iron condors. And for a related diagonal strategy using long calls, check out the Poor Man's Covered Call.
Related Articles
- Options Greeks Explained: Income Trader's Guide - Master theta, delta, and vega for spreads
- Put Credit Spreads: Risk-Defined Income Strategy - Learn the bullish counterpart
- Iron Condor Strategy: Profit from Range-Bound Markets - Combine put and call spreads
- Poor Man's Covered Call: Capital-Efficient Income Strategy - Alternative diagonal call strategy