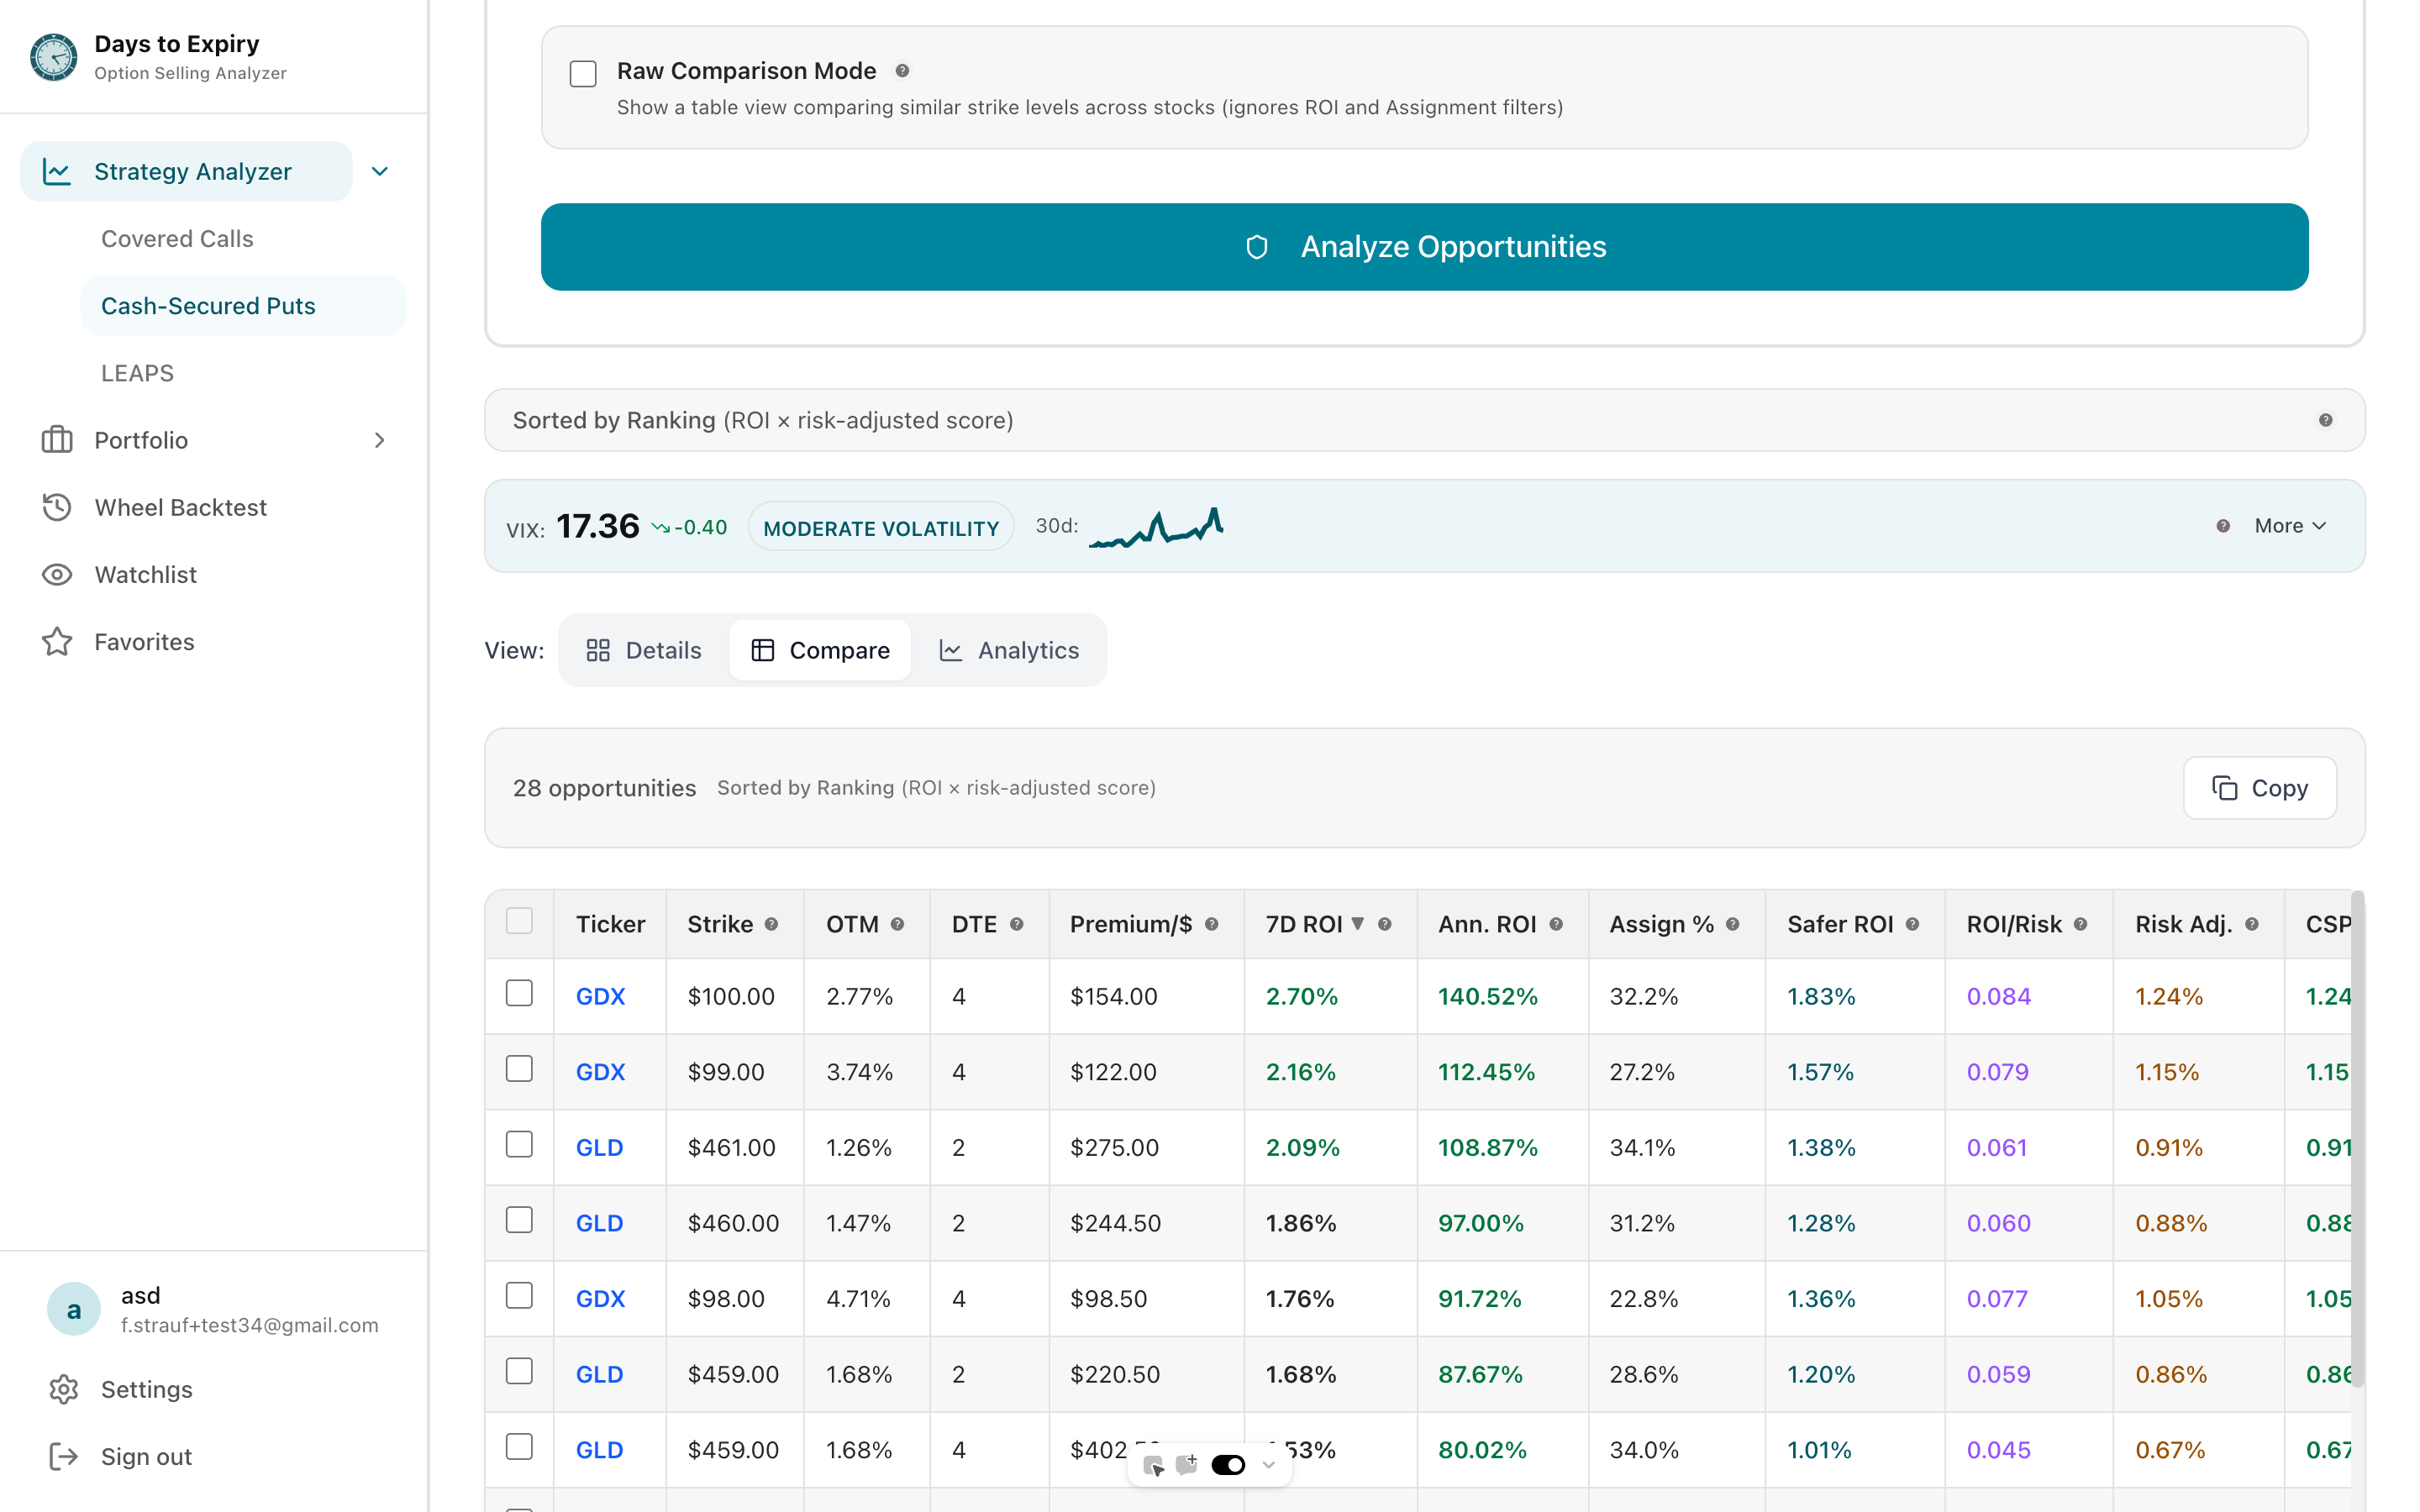
Days to Expiry — Option Selling Analyzer logo
Days to Expiry
Option Selling Analyzer

Turn options into predictable income—without guesswork.

Find high‑ROI covered calls, cash‑secured puts, and long calls with real‑time pricing and backtested assignment rates.

Live market data
Backtested validation
IB portfolio analysis

General information only. Not financial advice.

TickerStrikeDTEROIRisk
AAPL$23014d12.4%18%
MSFT$42021d9.8%12%
NVDA$1457d15.2%32%

Ranked opportunities, tuned to your risk tolerance.

Problem → Promise

Why traders struggle

  • ×

    Too many strikes, not enough signal.

  • ×

    ROI looks good—until assignment risk bites.

  • ×

    Spreadsheets don’t match live markets.

What you get instead

  • Ranked opportunities, tuned to your risk tolerance.

  • Real-time pricing + annualized ROI, OTM%, assignment probability.

  • Backtests on every candidate—validate before you enter.

Tell the analyzer your risk and ROI target—get ranked candidates.

See the trade before you place it

Every opportunity shows the metrics that matter—no more guesswork.

#1AAPLCovered Call

230 strike · 14 DTE

Premium

$2.70

OTM %

0.68%

230 vs 228.45

7d ROI

1.08%

$2.70 premium

Ann. ROI

28.2%

if held to exp

Assign %

18%

#2MSFTCovered Call

425 strike · 21 DTE

Premium

$3.85

OTM %

1.19%

425 vs 420.12

7d ROI

0.86%

$3.85 premium

Ann. ROI

15.1%

if held to exp

Assign %

22%

Ranked opportunities with full metrics—compare across strategies and backtest before entering.

Annualized ROI

Normalized yield (premium / capital) × (365 / DTE) to compare opportunities across different expiration dates.

Assignment %

Probability calculated from OTM%, volatility, and historical patterns. Lower = safer, but less premium collected.

Delta (Long Calls)

Probability the option finishes in-the-money. 45% delta = ~45% chance of profit at expiration.

Two ways to improve your options income

Portfolio Overview

Import IBKR (CSV or auto‑sync) and see premium income, weekly ROI, capital at risk, and coverage—down to the position and month.

Portfolio StatusLive
This week$489
Capital at risk$18.2k

See what you actually earned, not what you hoped.

Strategy Analyzer

Find covered calls, cash‑secured puts, and long calls across tickers with filters for ROI, DTE, OTM%, and assignment risk.

Covered CallsLive
AAPL 230c28.2%
MSFT 420c24.1%

Compare setups, backtest, then track outcomes.

See the portfolio in action

A quick walkthrough of what you can track and analyze

Built for disciplined income trading

We combine live pricing with historical behavior—then show the risk clearly.

Backtest Analysis

Assignment Distribution (6 months)
Assigned
42%
Expired
58%

Avg Hold Time

9.2 days

Win Rate

78%

Historical assignment rate by strike and DTE, win/loss distribution, average hold time.

Coverage Matrix

TickerSharesCoverage
AAPL200100%
MSFT10050%
NVDA500%
Fully covered
Partial
Naked

Fully covered, partially covered, and naked exposure at a glance.

Compliance note: Market data may be delayed. Past performance isn’t a guarantee of future results. All analytics are for educational purposes only.

How it works

1

Import your broker activity

Upload an IBKR statement (CSV) or use IBKR auto‑sync. Bring in trades and positions without spreadsheets.

2

Review income, ROI, and capital at risk

See premiums, weekly ROI, efficiency, coverage, and assignment history—then compare periods month by month.

3

Use tools to improve the next trade

Run the Strategy Analyzer and backtests to compare candidates, then track outcomes against your history.

Import your statement

Statement import or broker auto-sync

Portfolio dashboard

This week

$489

Avg weekly ROI

0.84%

Capital at risk

$18.2k

Income, ROI, and risk in one view

Opportunities + backtests

AAPL 230c
MSFT 420c
NVDA 145c

Compare candidates before you trade

Who uses Days to Expiry

Income-focused traders

Systematic premium collection across strategies.

Intermediate investors

Guided strike selection based on data and risk tolerance.

Wheel strategists

Consistent covered calls and CSPs with data-backed entries.

What makes us different

Backtested validation on every opportunity.

Real-time recalculation of ROI and assignment chance.

Side‑by‑side comparison across covered calls, CSPs, and long calls.

IB statement integration for true ROI (commissions included).

Results traders care about

I stopped guessing strikes—my weekly ROI stabilized.

Marcus T.

Options Trader

Backtests flagged risky DTEs I used to ignore.

Sarah L.

Income Investor

IB uploads turned my trade ledger into an income dashboard.

David M.

Wheel Strategist

Trader insights

50K+

Opportunities analyzed

18%

Median assignment threshold

14

Avg preferred DTE

Usage highlights from real traders analyzing strategies.

Loading pricing...

Start finding higher‑quality options income today

Join traders who’ve stopped guessing strikes. Analyze, backtest, and track with confidence.

Frequently asked questions

Can’t find what you’re looking for? Reach out to us directly—we’re here to help.