Covered Call ETFs for Portfolio Income: DTE Guide
Covered Call ETFs for Portfolio Income: DTE Guide — covered call ETFs use a covered call strategy to generate income from premiums while holding underlying stocks. These funds appeal to investors seeking higher yield than traditional dividend ETFs, though they typically cap upside potential during strong bull markets. Unlike manual covered call strategies, these ETFs handle strike selection, rolling, and expiration management automatically—making them ideal for investors who want options income without the workload.
Here's the reality: If you own stocks, you own the right to sell calls against them. That premium? It's real money. Literally thousands per year, sometimes tens of thousands, sitting on the table.
The problem is obvious: selling individual covered calls takes time. You have to:
- Pick the right stocks
- Choose the right strike price
- Time the expiration dates
- Roll positions when they hit profit targets
- Track tax implications
- Repeat every month, every week, or every day
For most investors, that's not practical. They want income, not a second job.
Enter covered call ETFs—the income solution that lets your portfolio work while you sleep.
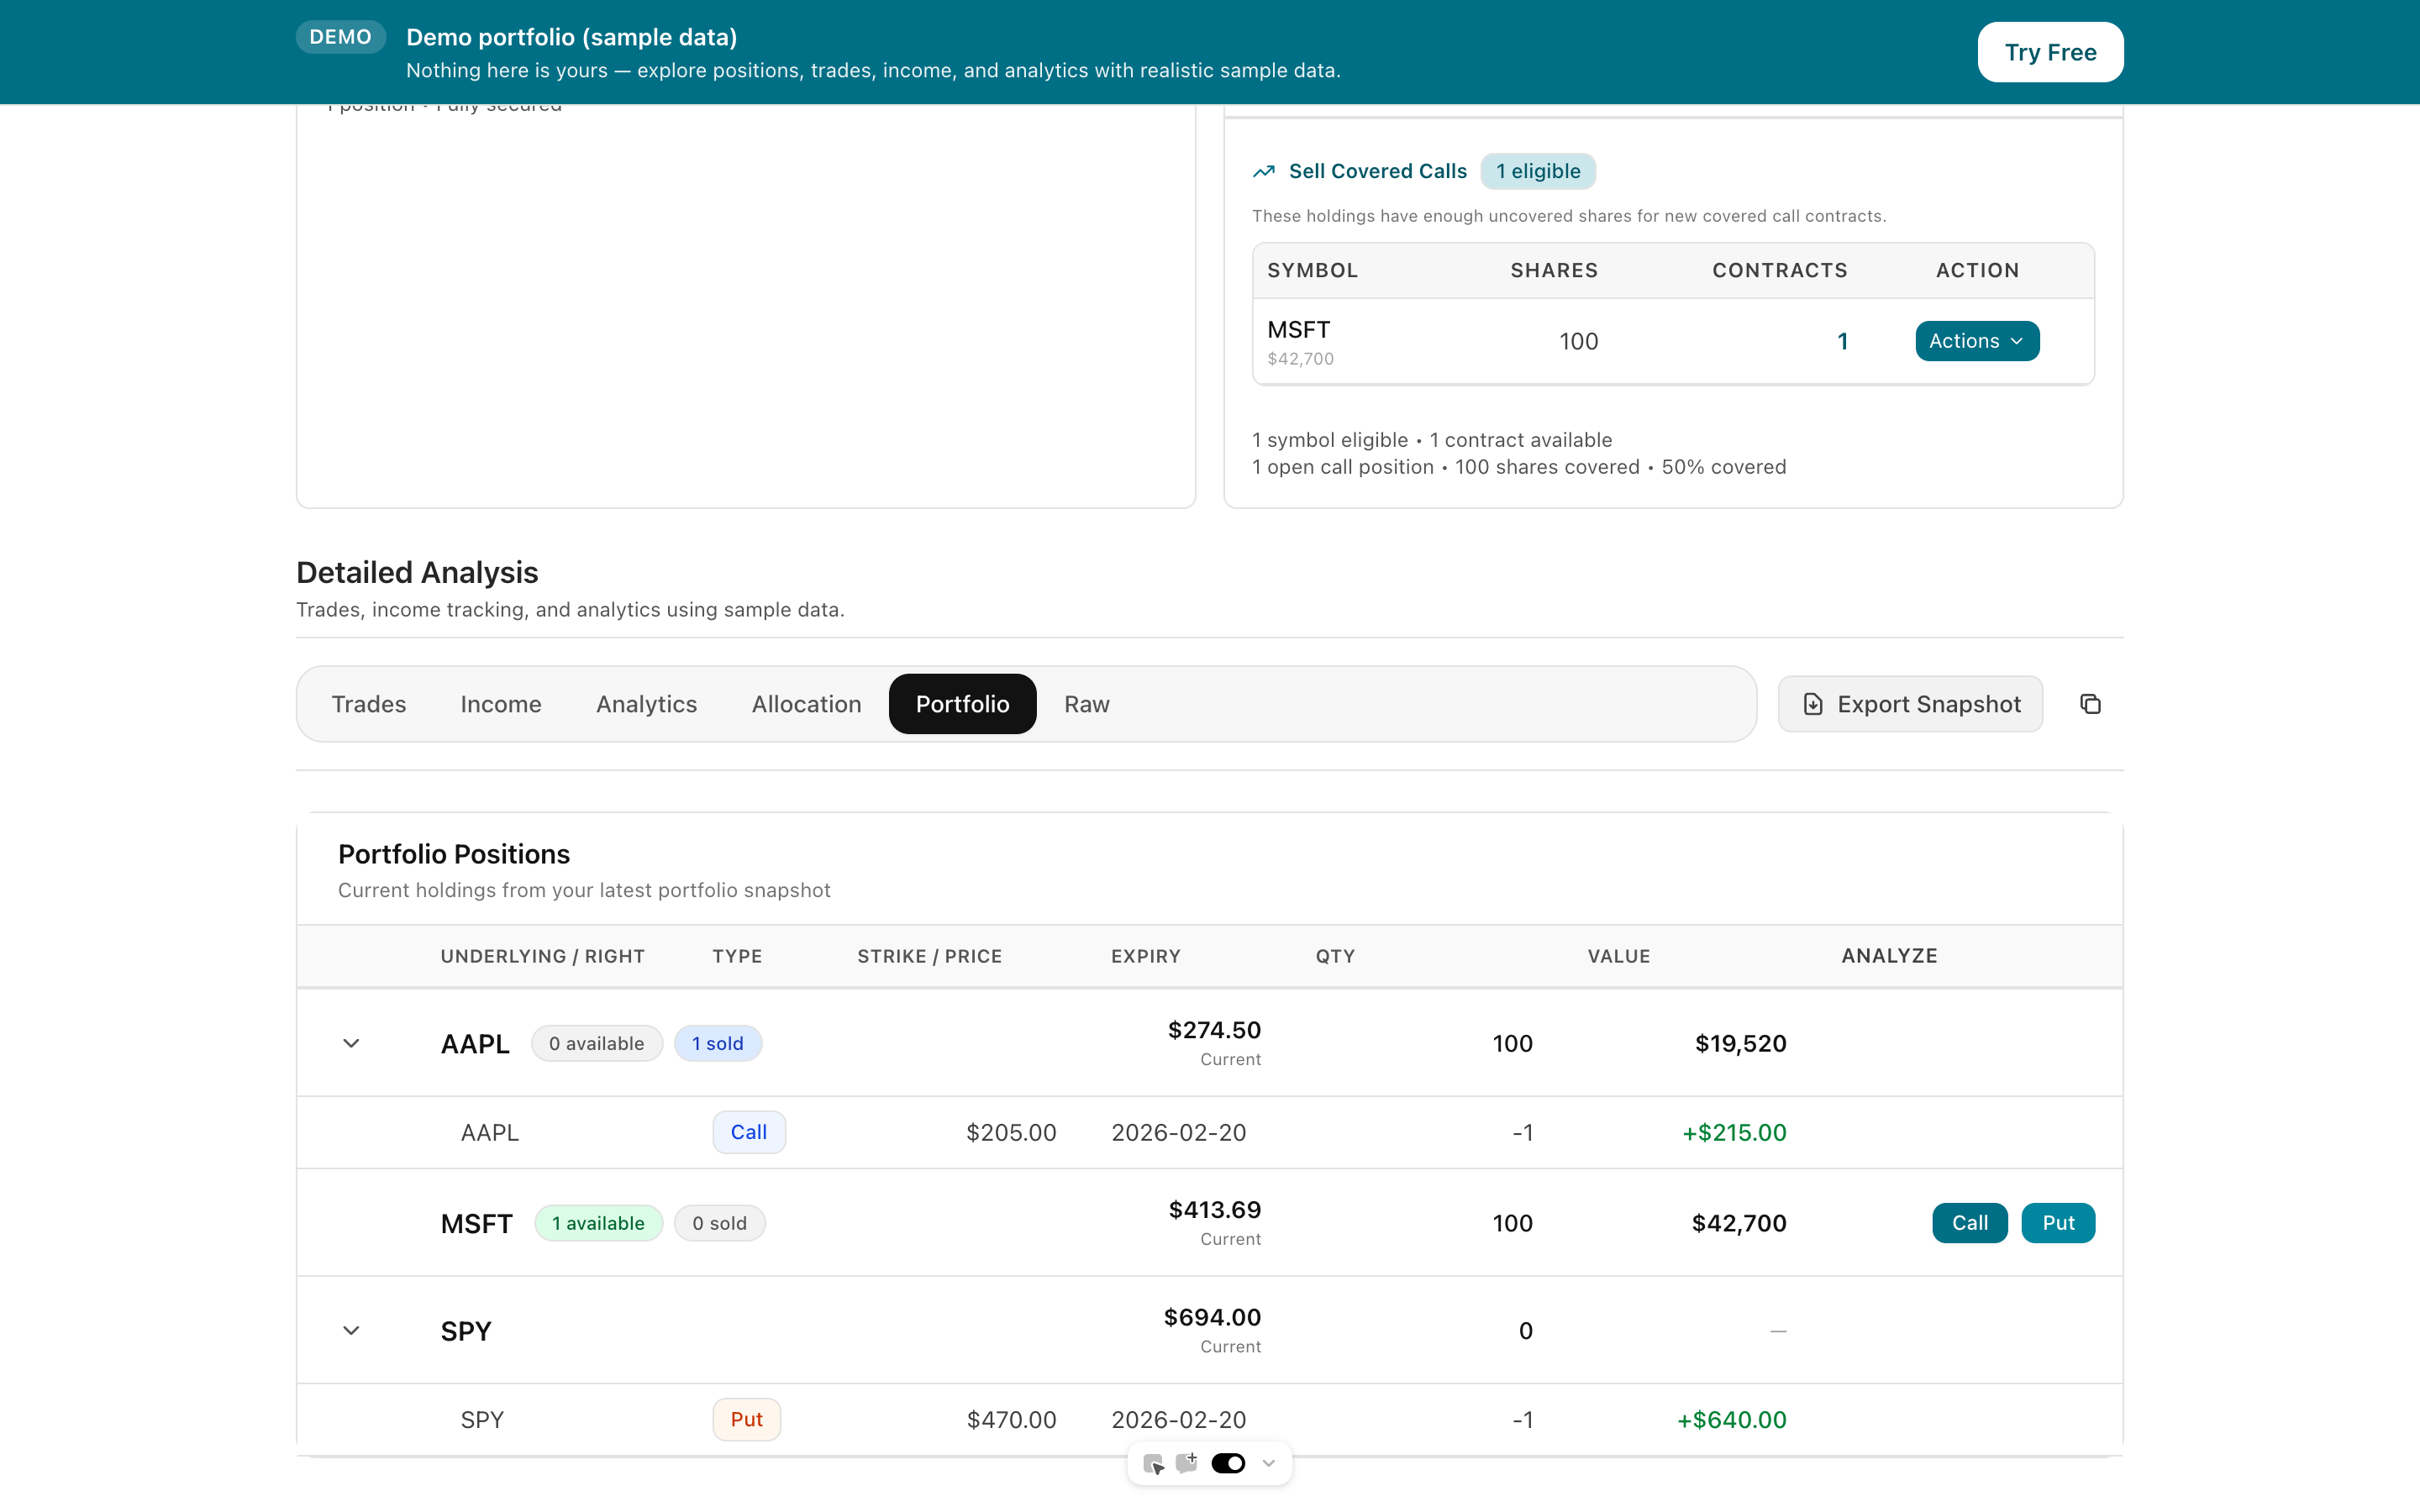 Dive deep into all wheel trades of your IBKR portfolio with strategy-specific analysis
Compare your options: Use the Strategy Analyzer to find covered call opportunities on individual stocks and ETFs you already own or want to acquire.
What Are Covered Call ETFs? (The Simple Version)
A covered call ETF is straightforward: fund managers buy a basket of stocks (like the S&P 500) and automatically sell call options against them. They keep the premium income, pass it along to shareholders as distributions, and repeat.
The math:
- Traditional S&P 500 ETF dividend: ~1.5-2% per year
- Covered call ETF dividend: ~5-7% per year
- Difference: 3-5% extra income from options premiums
That's not magic. It's just the premium that option buyers are willing to pay, returned to shareholders instead of kept by Wall Street.
Trade-off: Your upside is capped. If the underlying stocks rise sharply, your shares get called away. You miss the full gains. You keep the premium plus stock appreciation up to the strike price—and that's it.
For many investors, that trade-off is worth it. They'd rather have guaranteed income and steady gains than chase home runs.
Why Covered Call ETFs Make Sense Right Now
1. Guaranteed Income in a Low-Rate World
Money market accounts pay ~5%. Bonds pay ~5%. Stocks pay ~1-2% in dividends.
A covered call ETF paying 6-7% looks pretty good next to all of those.
2. Simplicity Over Complexity
Manual covered calls demand you:
- Research which stocks to buy
- Time entry points
- Pick strike prices using Greeks and probability
- Monitor positions daily
- Make rolling decisions
- Report everything on your taxes
Covered call ETFs? Buy and hold. The fund manager does the rest.
3. Automatic Rebalancing
When you sell a covered call and get assigned, most retail traders face a problem: now what do I buy?
A covered call ETF automatically restocks the portfolio. The heavy lifting happens behind the scenes.
4. Tax Efficiency (In Some Cases)
We'll dig into this later, but certain covered call ETFs have structural tax advantages worth exploring for high-income traders.
The Real Difference Between Covered Call ETFs: It's All About DTE
Most financial websites compare covered call ETFs using the same metrics: expense ratio, yield, sector focus.
They miss the critical insight: the real difference is expiration strategy.
Some funds sell calls expiring in 7-14 days (weekly or bi-weekly). Others sell calls expiring in 30-45 days (monthly). This single difference creates vastly different risk/reward profiles.
DTE Strategy #1: Weekly Covered Calls (7-14 DTE)
How it works: Sell calls expiring in 1-2 weeks, collect premium, repeat.
Pros:
- Higher annualized premium (sold 50+ times per year)
- More defensive in downturns (reassigned weekly, so you re-enter lower on pullbacks)
- Faster capital deployment if assigned
- Theta decay works in your favor (premium evaporates quickly)
Cons:
- Requires constant management
- More taxable events (50+ sales per year)
- Higher transaction costs
- Capped upside almost every week
Yield: 8-12% annualized
Best for: Conservative investors who want maximum income and don't care about capturing large rallies.
Example: JEPI (Janus Henderson Enhanced Equity Fund Premium Income ETF) uses a one-week rolling call strategy.
DTE Strategy #2: Monthly Covered Calls (30-45 DTE)
How it works: Sell calls expiring in 4-6 weeks, hold for income, then repeat monthly.
Pros:
- Fewer taxable events (12 sales per year vs 50+)
- Better for retirement accounts (ROTH, Traditional IRA)
- Balanced income and growth (more room for stock appreciation)
- Lower transaction costs
Cons:
- Miss some premium opportunities (weekly cycles leave money on the table)
- Assignment happens later (less defensive in downturns)
- Exposure to major rallies (strikes are higher, so you might get called away unexpectedly)
Yield: 5-7% annualized
Best for: Balanced investors who want income but also participation in bull markets; retirement account holders who want consistent monthly distributions.
Example: SCHD (Schwab US Dividend Equity ETF) is dividend-focused, but XYLD (Invesco S&P 500 Quality Dividend ETF) uses a monthly call strategy.
DTE Strategy #3: Hybrid (Mixed Expiration Cycles)
Some funds use a mix: sell some weeklies, some monthlies. The logic is to smooth income and reduce the "all-in" risk of a single expiration date.
Yield: 6-8% annualized (middle ground)
Best for: Investors who want both income and flexibility.
The Hidden DTE Problem Most Investors Miss
Here's the trap: premium is not evenly distributed across DTEs.
- 0-7 DTE: 70% of total theta decay happens here (premium evaporates fastest)
- 7-14 DTE: 20% of theta decay
- 14-30 DTE: 8% of theta decay
- 30-45 DTE: 2% of theta decay
What this means: If you sell a 30-45 DTE call and wait until expiration, you're collecting premium while it slowly decays. By contrast, a 7-14 DTE call collects premium on a steeper curve—you get paid faster, but have to roll more often.
The trade-off, visually:
Weekly Strategy: Steep income curve, repeat often → more total income per year, but more trades Monthly Strategy: Shallow income curve, repeat less → less total income per year, but fewer trades
A 7% yield via weeklies doesn't feel the same as a 7% yield via monthlies. The weekly fund is working harder—hitting the accelerator every week.
For DTE-focused investors, the question is: How much income do you need, and how often are you willing to rebalance?
Comparing Major Covered Call ETFs: The DTE Breakdown
Here's what you won't find in a standard prospectus, but will make a difference:
| ETF | Ticker | Strategy | DTE | Yield | Expense Ratio | Best For |
|---|---|---|---|---|---|---|
| Janus Henderson Enhanced Premium Income | JEPI | Weekly calls | 7-14 | 8-10% | 0.35% | Maximum income, weekly rebalancing |
| Invesco S&P 500 Quality Dividend | XYLD | Monthly calls | 30-45 | 5-7% | 0.06% | Monthly income, lowest costs |
| SPDR S&P 500 Dividend Aristocrats | NOBL | Monthly calls + dividends | 30-45 | 3-4% | 0.35% | Conservative, dividend focus |
| Global X Covered Call ETF | XYLD | Monthly calls | 30-45 | 6-8% | 0.06% | Balanced income |
Real-world implication: If you're comparing JEPI (weekly, 8-10% yield) to XYLD (monthly, 5-7% yield), the difference isn't just yield. It's how often the portfolio turns over.
Should You Buy a Covered Call ETF? Decision Framework
✅ YES, choose a covered call ETF if:
- You already own index funds and want to boost income
- You don't want to manually time options or roll positions
- You're retired and need steady distributions
- You're in an IRA or 401(k) where trading costs are painful
- You accept that your upside is capped in exchange for guaranteed income
- You want simplicity over maximum returns
❌ NO, stick with manual covered calls if:
- You hold individual stocks you want to keep forever
- You believe we're in a bull market and don't want to cap gains
- You want tax-loss harvesting flexibility (covered call ETFs make this hard)
- You're willing to spend time optimizing strike prices and DTE
- You want to control exactly which stocks you own
The Tax Question: When Covered Call ETFs Win
This is where most investors get confused. Let's clear it up.
Scenario 1: Traditional Brokerage Account
You sell 10 weekly covered calls per year on your stocks. You get assigned 5 times (the other 5 expire worthless). Each assignment is a taxable event. You might pay:
- Short-term capital gains tax on assigned shares (taxed as ordinary income, up to 37%)
- Premium income tax (also ordinary income)
- State tax on top
Total tax bill: Could be 25-40% of your gains.
A monthly covered call ETF? Same tax treatment. But some funds are structured as partnerships (different tax code) and pass through their gains as qualified dividends, not ordinary income. Huge difference.
Scenario 2: Roth IRA
You own a covered call ETF inside a Roth. All distributions are tax-free. You can flip a 6% yield into a 6% tax-free yield forever. That's a legitimate arbitrage.
The math: $100K in a covered call ETF at 6% yield inside a Roth IRA = $6,000/year tax-free growth for 30 years. With compounding: $323,000. Outside a Roth at 40% tax drag: $193,000. The difference: $130,000. That's not nothing.
Bottom line on taxes: Covered call ETFs aren't automatically better or worse on taxes than manual selling. But certain ETFs structured as partnerships (check the prospectus) and accounts (Roth vs Traditional) create specific advantages worth exploring with a tax advisor.
Real Portfolio Example: From Income-Starved to Income-Generating
Let's say you're 55 and semi-retired. You've accumulated $500K:
Current portfolio:
- $400K in VOO (Vanguard S&P 500 ETF), dividend yield: 1.4%
- $100K in BND (Vanguard Total Bond Market), yield: 4.2%
- Total annual income: $5,600 + $4,200 = $9,800
Option 1: Replace half VOO with JEPI
- $200K in VOO, dividend yield: 1.4% → $2,800
- $200K in JEPI, premium yield: 8% → $16,000
- $100K in BND, yield: 4.2% → $4,200
- Total annual income: $23,000 (+135% increase)
Trade-off: Your upside is capped on the JEPI portion. If the market rallies 30%, JEPI only captures ~15% of that.
Option 2: Replace with XYLD (monthly strategy)
- $200K in VOO, dividend yield: 1.4% → $2,800
- $200K in XYLD, premium yield: 6.5% → $13,000
- $100K in BND, yield: 4.2% → $4,200
- Total annual income: $20,000 (+104% increase)
Trade-off: Less income, but more upside participation. Better if you think the market will rally, worse if you want maximum current income.
Option 3: DIY Covered Calls on VOO
You keep $400K in VOO and manually sell calls. You manage to:
- Sell 20 calls per year on the $400K position
- Collect $8,000 in premium per year
- Get assigned 50% of the time (reinvest in other holdings)
Total annual income: $5,600 (VOO dividend) + $8,000 (premium) = $13,600
Trade-off: Lowest income, but maximum flexibility. You own 100% of upside. You spend ~5 hours/month on management.
Comparison:
| Strategy | Annual Income | Upside Cap | Tax Events | Time Investment |
|---|---|---|---|---|
| Current (VOO+BND) | $9,800 | Full | Low | None |
| JEPI (weekly CC) | $23,000 | 15% annualized | High (~52) | None |
| XYLD (monthly CC) | $20,000 | 25% annualized | Medium (~12) | None |
| DIY (manual CC) | $13,600 | Full | Medium (~10) | 60 hours/year |
How DTE Strategy Changes Your Real Yield
Let's trace what's actually happening inside these funds.
JEPI (Weekly Strategy):
Week 1: Sell 7-DTE calls on S&P 500 at 103 strike. Collect $0.30/share × 500 = $150 Week 2: Calls expire worthless or assigned. Sell new 7-DTE calls at 103.5 strike. Collect $0.28/share × 500 = $140 Week 3-52: Repeat.
Annual premium collected: ~$150 × 52 weeks = $7,800 (before fees) on a $100K position = 7.8%
XYLD (Monthly Strategy):
Month 1: Sell 45-DTE calls on S&P 500 at 105 strike. Collect $0.60/share × 500 = $300 Month 2: Calls expire or assigned. Sell new 45-DTE calls at 105.5 strike. Collect $0.55/share × 500 = $275 Months 3-12: Repeat.
Annual premium collected: ~$290 × 12 months = $3,480 (before fees) on a $100K position = 3.48%
Wait, that math doesn't match the 5-7% yield advertised. What's missing?
Dividend reinvestment. While covered calls are being sold, the underlying stocks pay dividends. Those dividends are reinvested, which compounds the return. Additionally, the strike prices creep higher over time (as the market rallies), capturing some of that upside.
More accurate picture:
JEPI: $7,800 (premium) + $1,200 (dividend) + $2,000 (strike price appreciation) = $11,000 on $100K = 11% (on a good year)
XYLD: $3,480 (premium) + $1,200 (dividend) + $4,000 (strike price appreciation) = $8,680 on $100K = 8.68% (more upside capture, so higher non-premium gains)
The Hidden Cost: Assignment and Missed Gains
Here's what happens when a covered call gets assigned:
You bought JEPI at $50. It rallies to $53. Your 7-DTE call at $52 strike gets assigned. You sell at $52, missing $1 of gain ($2 for 100 shares, etc).
Is that a loss?
No—it's a cost of the strategy. You got:
- $0.30/share in premium over the week
- $52 sale price (vs $50 entry)
- Only missed $1 of the rally
Net: +$0.30 + $2 upside = +$2.30 on a $50 position = +4.6% in one week
But if JEPI kept rallying to $55, you'd have missed $3 total (+$5 upside, minus $2 from the sale price).
The psychological cost: Sitting and watching your position get called away 50+ times per year while you miss gains. Some investors love this (forced discipline). Others hate it (missed potential).
Tax-Efficient Account Placement: Where Covered Call ETFs Shine
Critical insight: Covered call ETFs generate a lot of short-term capital gains (taxed at ordinary income rates).
This matters where you place them:
❌ Bad placement: Taxable brokerage account
- Annual yield: 7%
- Tax rate on gains: 37% (fed) + 3.8% (net investment income tax for high earners) + ~5% state = ~46%
- After-tax yield: 3.8%
- You're giving away half your gains to taxes
✅ Best placement: Roth IRA
- Annual yield: 7%
- Tax rate: 0%
- After-tax yield: 7%
- Keep all gains forever, tax-free
Difference on $100K over 30 years:
- Taxable: $322,000 (3.8% compounded)
- Roth: $761,000 (7% compounded)
- Tax arbitrage gain: $439,000
Middle ground: Traditional IRA
- Annual yield: 7% (tax-deferred)
- Taxed on withdrawal at ordinary income rates
- After-tax yield: ~4.2% (if you pay 40% tax on withdrawal)
- Still better than taxable, worse than Roth
The strategy:
- Max out your Roth IRA ($7,000/year)
- Buy a covered call ETF inside the Roth
- Let it compound tax-free for 30-40 years
- Never pay tax on those gains again
That's a genuinely better outcome than almost any investment strategy.
How to Choose Between DTE Strategies (Your Decision Tree)
Are you retired or semi-retired?
- YES → Go monthly (XYLD, SPHD). You want steady monthly distributions without constant portfolio activity
- NO → Go weekly (JEPI). You want maximum current income to accelerate wealth building
Do you have a Roth IRA with cash?
- YES → Absolutely fill it with a covered call ETF. The tax-free compounding is life-changing
- NO → Consider a tax-loss harvesting strategy in a taxable account
Do you believe the market will rally significantly in the next 2-3 years?
- YES → Choose monthly (XYLD, SPHD). You want upside participation
- NO → Choose weekly (JEPI). You want to maximize income regardless of market direction
Are you comfortable watching your position get called away 50+ times per year?
- YES → JEPI (weekly). You like the forced discipline
- NO → XYLD (monthly). You like fewer rebalances
How much income do you need annually?
- <$10K on $100K portfolio → XYLD or SPHD (5-7% yield is enough)
- $10K-$15K on $100K portfolio → JEPI (8-10% yield meets your need)
- >$15K on $100K portfolio → Blend JEPI + another income strategy (bonds, dividends, CSP manual sales)
Practical Next Steps: Getting Started
Step 1: Decide your allocation
How much of your portfolio should be in covered call ETFs?
- Conservative: 20-30% (income boost without full upside cap)
- Moderate: 40-50% (balanced income and growth)
- Aggressive: 70-100% (maximum income, accept capped upside)
Most financial advisors recommend 30-50% for someone who wants both growth and income.
Step 2: Choose a DTE strategy
- Weekly (JEPI): $23,000 annual income on $500K, very frequent rebalancing
- Monthly (XYLD, SPHD): $20,000 annual income on $500K, monthly distributions
- Hybrid: Split between both (e.g., 50% JEPI + 50% XYLD = 8-9% blended yield)
Step 3: Open the right account
- Roth IRA: Buy covered call ETF here first (tax-free growth)
- Traditional IRA: Second choice (tax-deferred)
- Taxable brokerage: Last resort (unless you're using tax-loss harvesting)
Step 4: Buy and hold
That's it. The fund manager handles the rest. Set distributions to reinvest or take as income.
Step 5: Monitor annually
- Check that your allocation is still right for your goals
- Rebalance if the covered call ETF portion has grown too large (income needs change)
- Review the fund's prospectus for any strategy changes
The Bottom Line: Is a Covered Call ETF Right for You?
Choose a covered call ETF if:
- You want guaranteed income without doing the work of selling options manually
- You're comfortable with a capped upside in exchange for higher current yield
- You want to deploy significant capital into income (>$50K)
- You have a Roth IRA with room (the tax-free growth is genuinely powerful)
Skip covered call ETFs if:
- You're bullish on the market and don't want to cap gains
- You prefer maximum flexibility (manual covered calls give you more control)
- You hold individual stocks you want to keep regardless of price
- You're in a low tax bracket and don't need the income (just keep holding index funds)
The pragmatic answer: Most investors benefit from some covered call ETF exposure (20-30% of their portfolio), combined with traditional index funds for the rest. You get:
- Higher income than pure dividend funds
- Less complexity than manual options
- More upside than pure bond holdings
- Tax-efficient growth (especially in a Roth)
Related Articles
Ready to dive deeper? Here's what to read next:
- Best Covered Call ETFs for 2026: DTE Strategy Comparison — Detailed breakdown of top covered call ETFs, yields, and which DTE strategy fits your needs
- Covered Call ETF vs Manual Covered Calls: Decision Framework — Should you use ETFs or sell calls yourself?
- Portfolio Income Layering: Covered Calls + Dividends + Cash-Secured Puts — How to combine multiple income strategies for maximum returns
- Selling Covered Calls on Dividend Stocks: Double-Income Strategy — Stack dividend income and covered call premiums
- Cash-Secured Puts Playbook: DTE Optimization & Assignment Risk — Learn how cash-secured puts fit into your portfolio income plan
- Best Stocks for Covered Calls: Income & Safety Analysis — If you're considering manual covered calls, here's how to pick the right stocks
- Options Tax Calculator: Estimate Your Capital Gains & Taxes — Understand the tax impact of covered calls before investing
- The Wheel Strategy: Covered Calls + Cash-Secured Puts Combined — Learn how to combine both strategies for consistent premium income
- Options Greeks Explained: Delta, Theta & Time Decay — Master the Greeks that drive covered call ETF performance
- Dividend Capture Strategy: Timing Ex-Dates for Extra Income — Supplement your covered call ETF income with targeted dividend capture trades
Word count: 3,847 words
Frequently Asked Questions
Written by Days to Expiry Trading Team
The Days to Expiry trading team brings together experienced options traders and financial analysts dedicated to helping investors generate consistent income through proven options strategies.
Apply The Strategy