Calculate Returns, Breakeven & Assignment Risk in Real-Time
Sick of spreadsheets? Missing critical numbers before hitting sell? Our cash-secured put calculator shows you exactly what you'll earn, where you break even, and how likely assignment is—all before you place the trade.
Tap to view full size
Missing Breakeven Calculation — Your spreadsheet doesn't calculate breakeven, so you're guessing on risk
No Real-Time Assignment Probability — You're selling puts without knowing how likely assignment is
Fragmented Data Across Tools — Premium from Tastytrade, assignment odds from Reddit, Greeks from your broker
Where you profit/lose if assigned
Historical odds for this strike/DTE combo
Exact dollars earned upfront
Return if assignment happens
Return before next expiration cycle
Safety margin on your entry
Tap to view full size
Estimate income from selling covered calls or cash-secured puts
Need more capital to start
Try $57,000 or switch strategies
See how much extra you could earn with cash-secured puts vs "safe" alternatives
Ticker, strike price you're selling, current premium, days to expiration, capital reserved
See exact breakeven, historical assignment likelihood, profit if not assigned, profit if assigned
Compare strikes side-by-side, test what-if scenarios, and only trade when the math makes sense
Trader insight: Low assignment risk, solid premium, good ROI. This is a go.
Breakeven Price
$225.50
Assignment Probability
28%
Profit if NOT Assigned
$450
Annualized ROI
33.8%
Master CSP timing and DTE selection
Find high-probability CSP opportunities
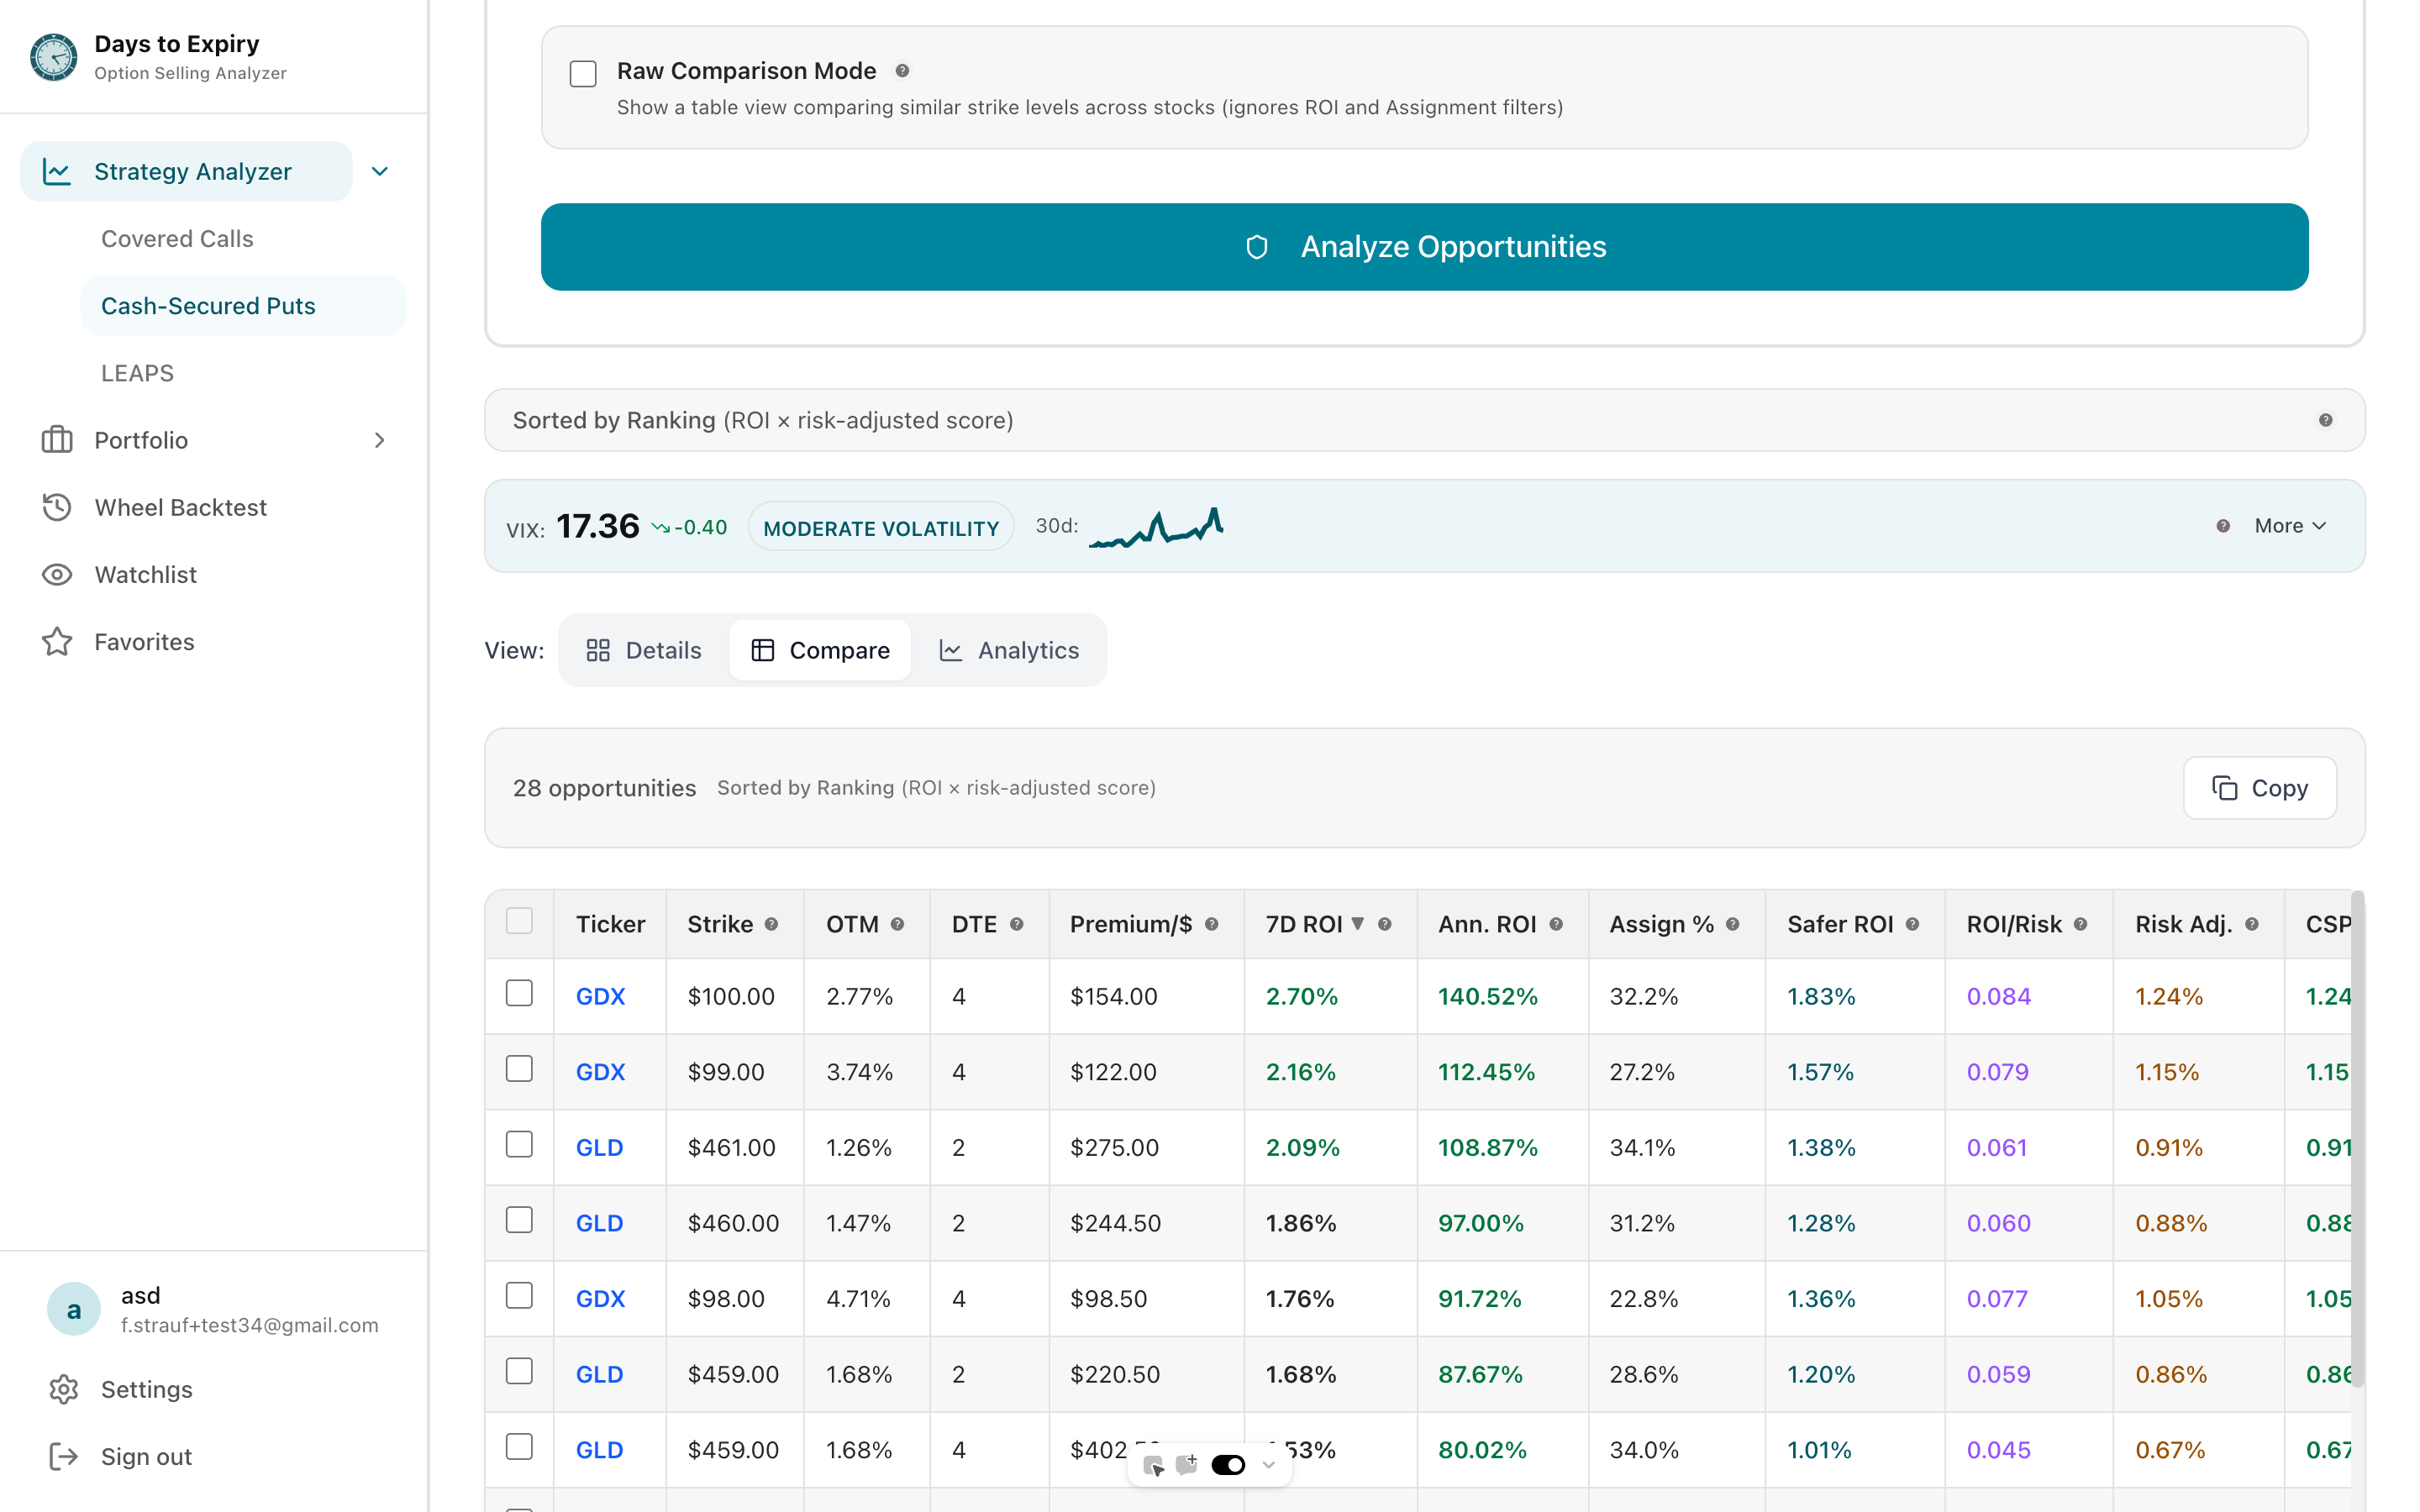
Current market opportunities for put selling
Curated watchlist for put selling candidates
Step-by-step platform tutorial
Daily updated put selling opportunities
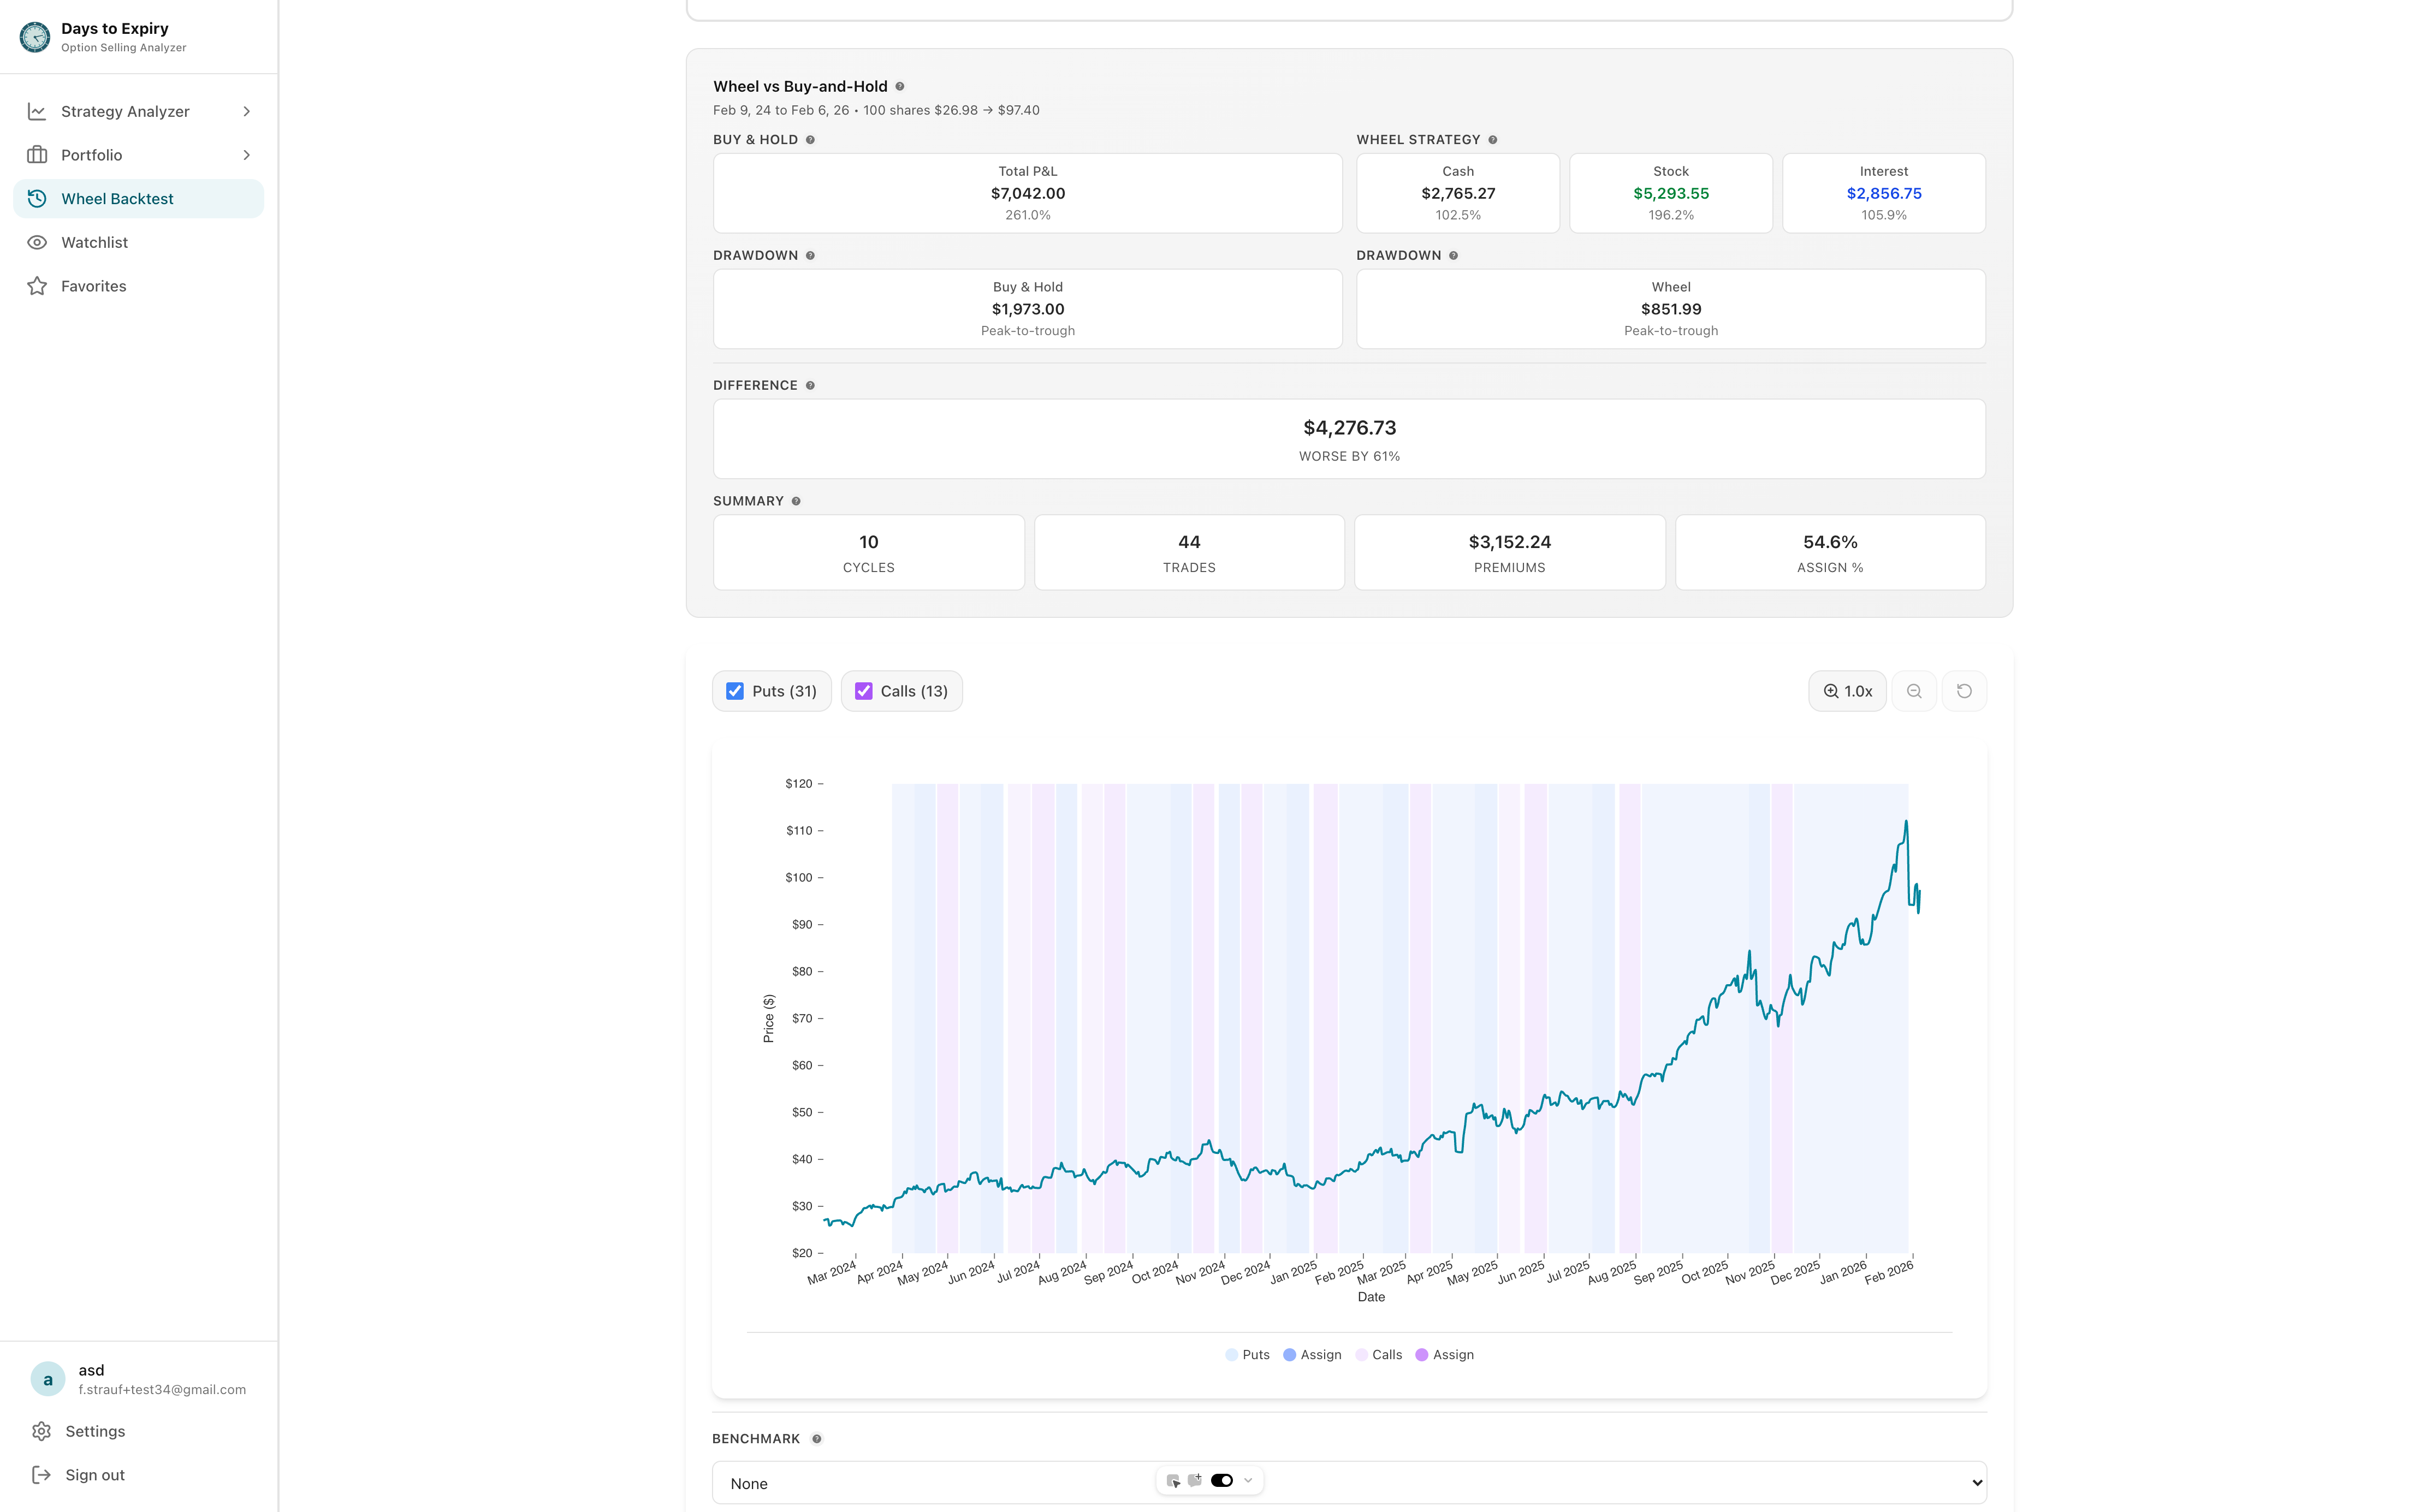
Compare both income strategies
Step-by-step execution guide
Extend your positions and compound returns
Complete execution walkthrough from order entry to management
Weekly updated stock picks for cash-secured puts
Track and analyze your options premium income
Master the cash-secured put strategy with our comprehensive guides. Learn optimal DTE selection, rolling techniques, and how to pick the best stocks.
Complete guide to strike selection, timing, and assignment risk
When and how to adjust positions for continuous income
Screening guide for high-probability put selling candidates
Evergreen criteria for identifying put-selling opportunities
Step-by-step platform tutorial for selling cash-secured puts
Current market opportunities for put selling
Curated watchlist for put selling opportunities
Complete execution guide from order entry to position management
Weekly updated picks for cash-secured put opportunities
Track and analyze your premium income across all trades
Use this to work backwards: enter your income goal and see what's required.
Work backwards: set your income goal and find the required capital
Everything you need to know about getting started