Discover High-Yield Income ETFs & Track Annual Returns
Overwhelmed comparing 3,000+ ETFs? Want to find which ones have the best covered call opportunities? Our ETF finder scans the entire ETF universe, shows which ones have liquid options, calculates annual covered call yields, and ranks them by income potential.
Tap to view full size
3,000+ ETFs to Choose From — Impossible to manually compare
Liquidity is Critical but Hidden — Bid/ask spreads vary wildly
Annual Yield Calculation is Manual — Complex multi-step math
Comparison is Fragmented — Data scattered across 5+ websites
You're Missing Obscure, High-Yield Opportunities — The best ones aren't mainstream
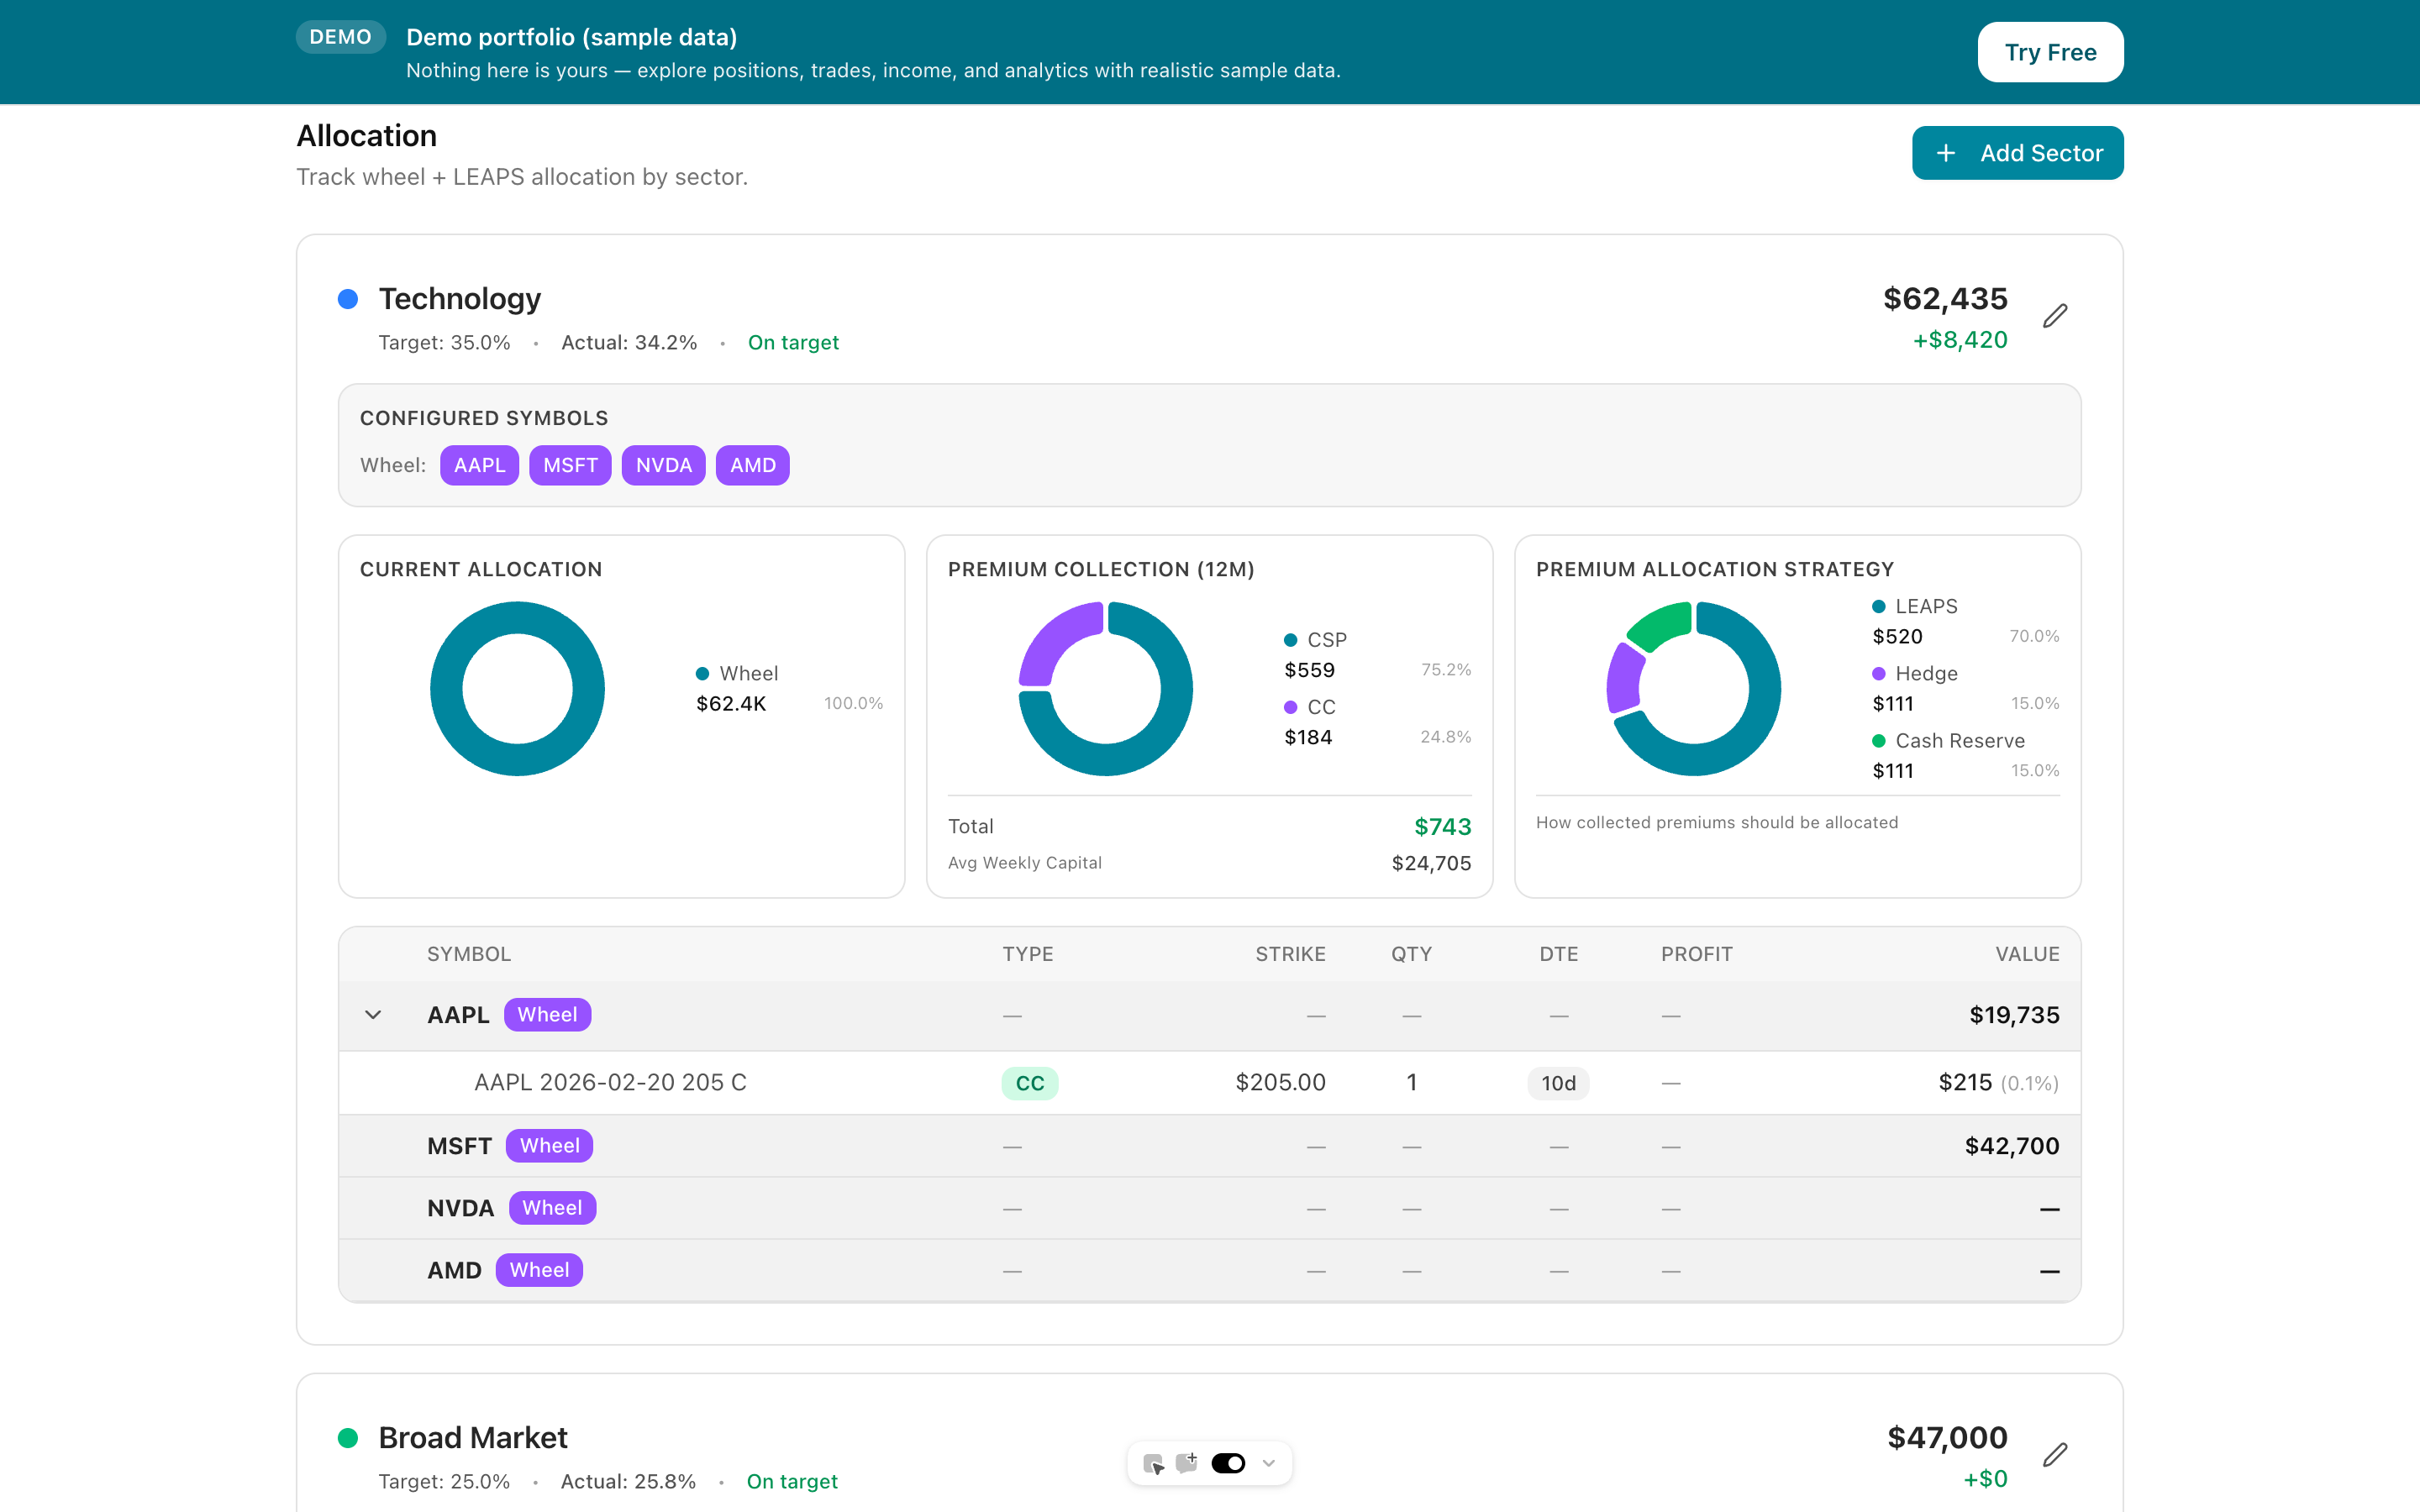
100+ ETFs at a glance
Bid/ask spread, volume
Calculated for each ETF
Tech, healthcare, financials, etc.
Zoom into any ETF's opportunities
CC yield + dividend yield - expenses
Tap to view full size
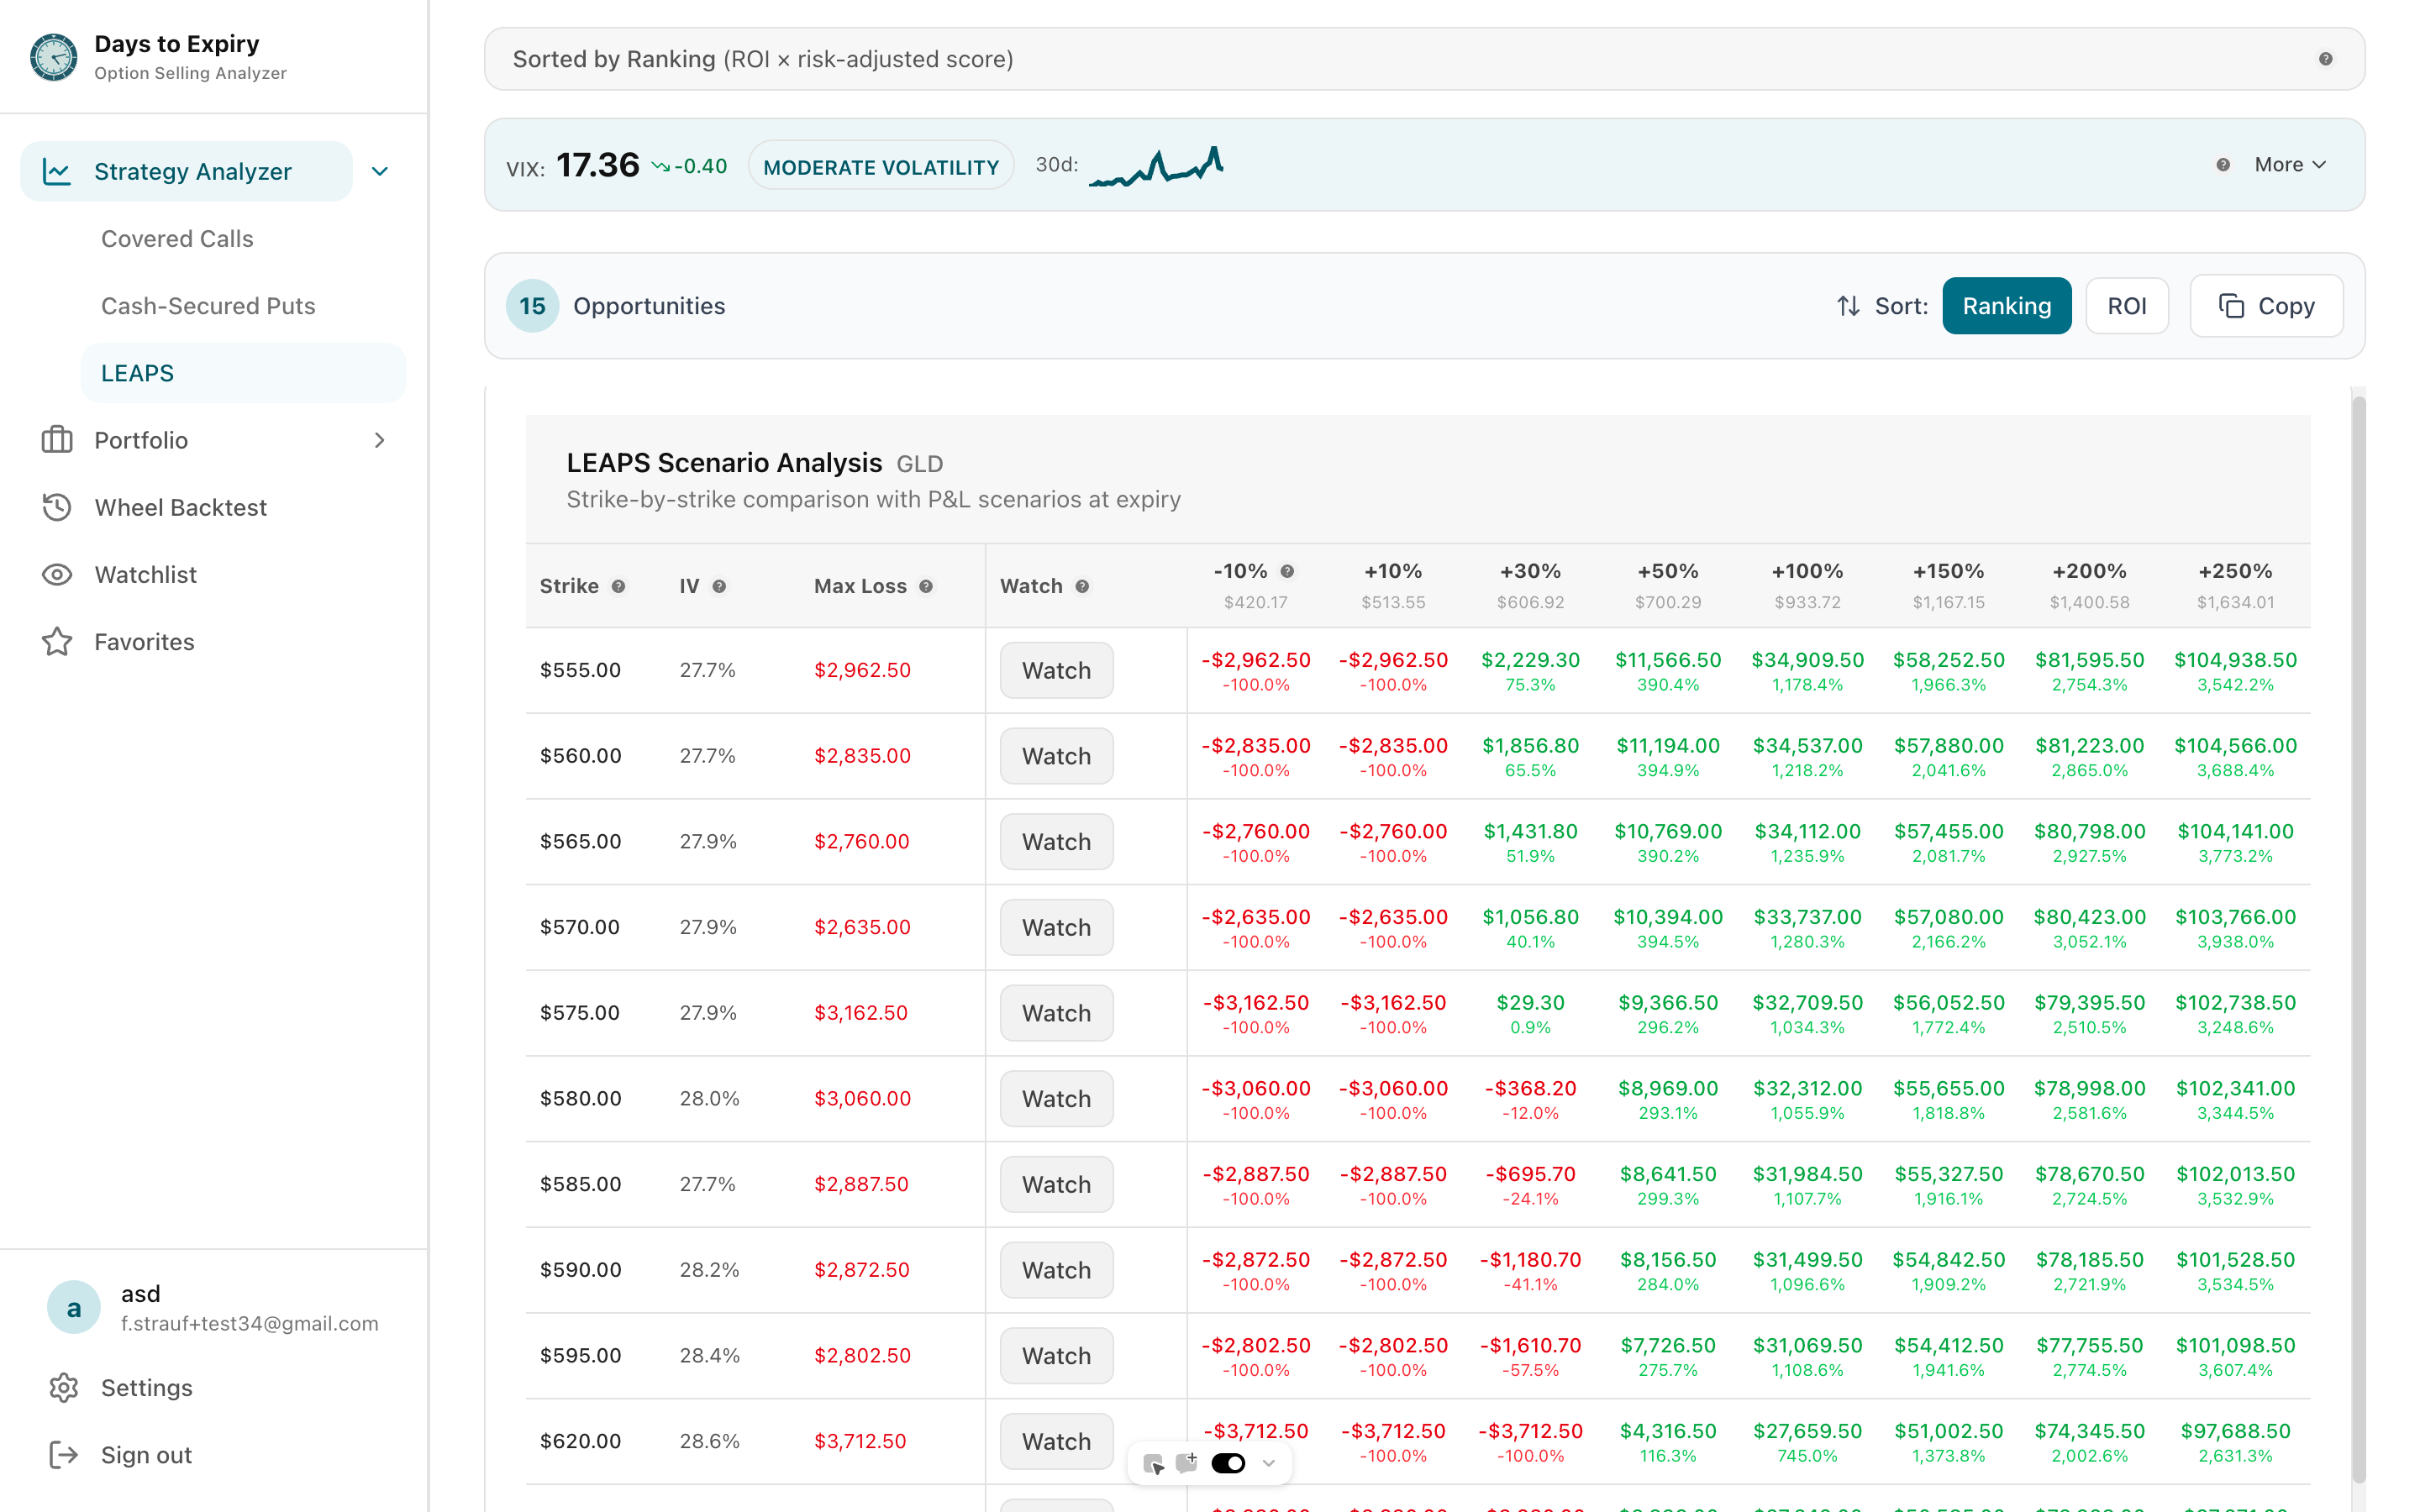
Estimate income from selling covered calls or cash-secured puts
Estimates based on simplified Black-Scholes. Actual premiums depend on live market conditions, liquidity, and bid-ask spreads. Verify in Strategy Analyzer.
All ETFs with liquid options chains displayed. Filter by sector, market cap, or yield type
Pick 3-5 ETFs and see expense ratio, dividend, CC yield, total yield, options quality
Click any ETF to see live covered call opportunities with calculated returns
| Metric | SPY | JEPI | QQQI |
|---|---|---|---|
| Expense Ratio | 0.03% | 0.35% | 0.20% |
| Dividend Yield | 1.80% | 3.50% | 0.50% |
| CC Annual Yield | 8% | 7% | 12% |
| Total Yield | 9.77% | 10.15% | 12.30% |
Decision: JEPI if you want growth + income. SPY if you want flexibility.
ETFs Analyzed
1,000+
Annual CC Yield
8-12%
Expense Ratio
0.03-0.60%
Total Yield Range
9-13%
Everything you need to know about getting started