Understand Delta, Gamma, Theta & Vega Instantly
Confused by options Greeks? Don't understand what delta, gamma, theta, and vega actually mean? Our calculator shows you exactly how each Greek impacts your trade—instantly, for any stock price, any expiration date.
Tap to view full size
Four Different Greeks, Four Different Impacts — Hard to track mentally
Greeks Are Constantly Changing — What matters today changes tomorrow
Multi-Leg Positions Are Impossible to Calculate Manually — Spreads multiply complexity
You Can't See Scenarios Without Real-Time Calculation — What if stock moves 10%? What if IV spikes?
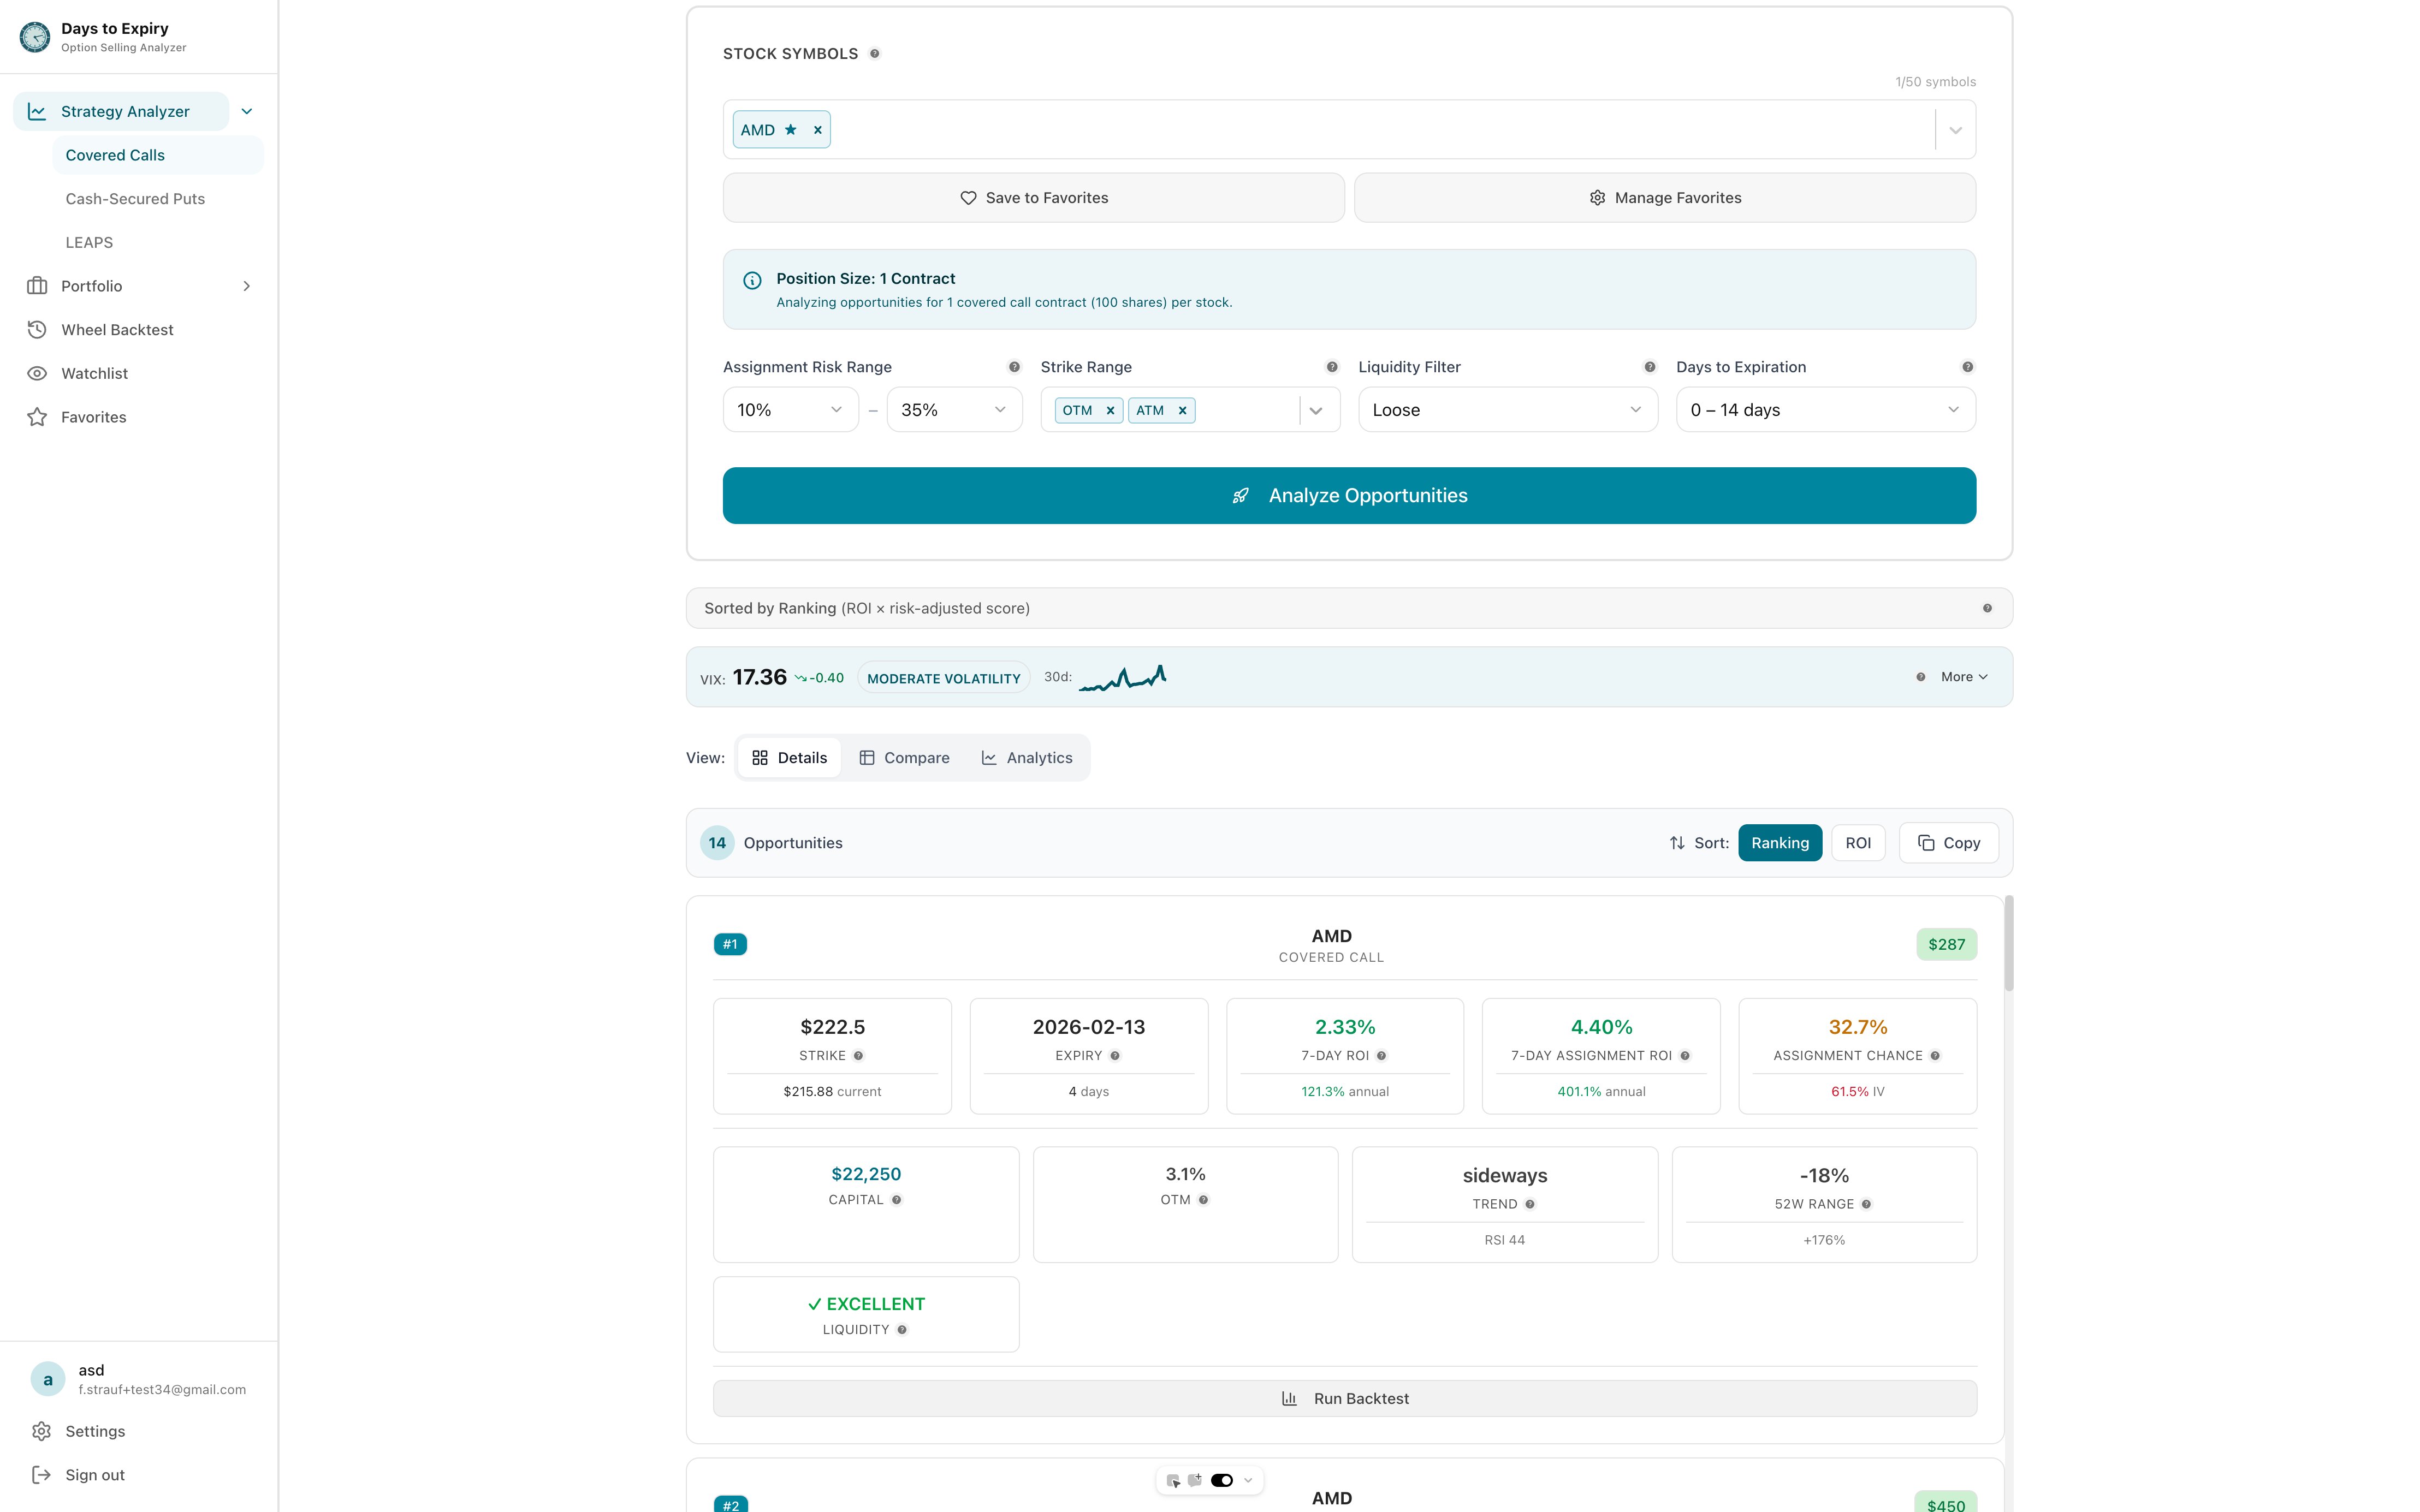
Delta, gamma, theta, vega all calculated
See Greeks at different stock prices
Calculate Greeks for spreads, straddles, etc.
Charts showing delta/gamma/theta/vega impact
What do these numbers actually mean?
Current P&L and breakeven at expiration
Tap to view full size
Deep dive into options Greeks with our comprehensive guides. Learn how delta, gamma, theta, and vega work together to affect your trades.
Beginner-friendly explanation of options Greeks
How Greeks behave at different days to expiration
Practical applications of vanna in options trading
Critical gamma risks every options seller must understand
Understanding theta decay in zero-days-to-expiration trades
When and why to close options positions early
Stock ticker, strike price, expiration date, call or put
Delta, gamma, theta, vega all calculated with real market data
Ask "what if" questions: stock moves to $250? IV spikes 10%? 1 week passes?
Decision: Bullish on AAPL , time decay manageable , IV potential to Buy the call
Delta
0.55
Gamma
0.04
Theta
-$0.08/day
Vega
+$0.18 per 1% IV
Beginner-friendly explanation of options Greeks
How Greeks behave at different days to expiration
Practical applications of vanna in options trading
Critical gamma risks every options seller must understand
Understanding theta decay in zero-days-to-expiration trades
When and why to close options positions early
Everything you need to know about getting started