Days to Expiry — Option Selling Analyzer logo
Days to Expiry
Option Selling Analyzer

Wheel Strategy Calculator

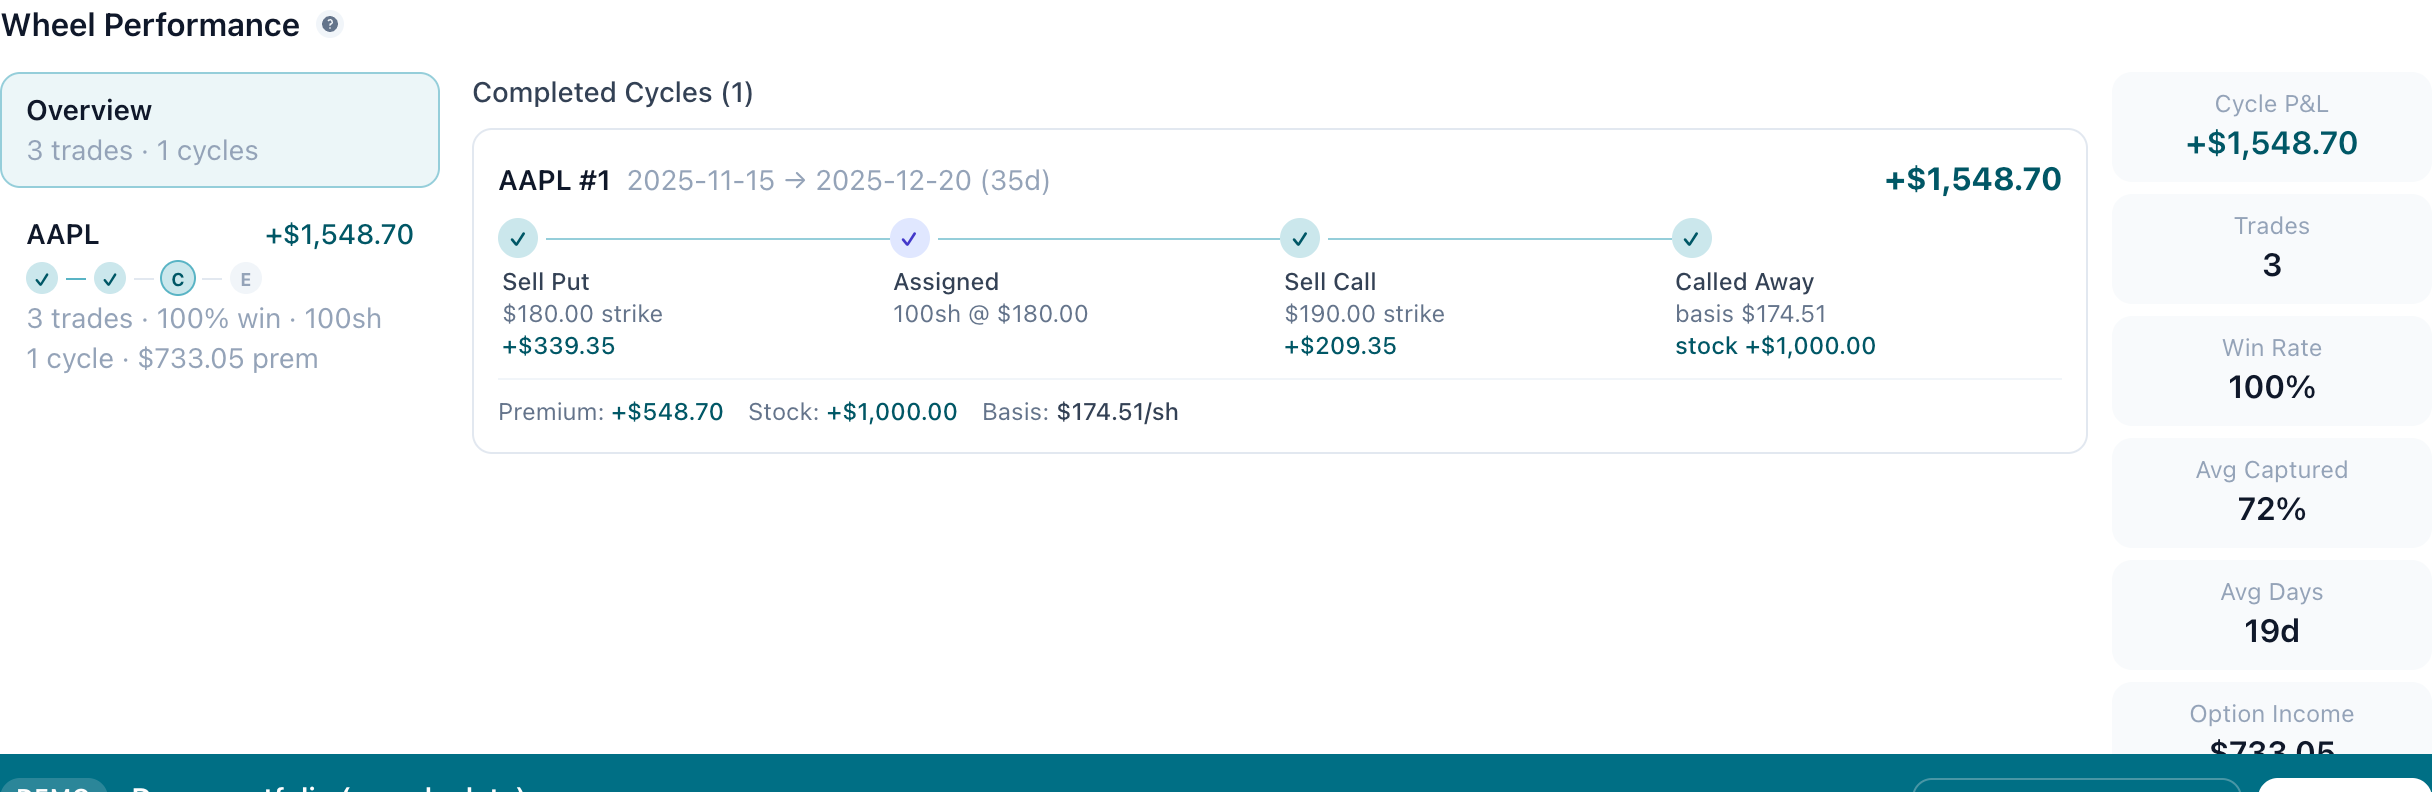
Track Covered Calls to Cash-Secured Puts to Repeat

Running the wheel strategy but can't see your total ROI across the full cycle? Wondering if your strategy is actually working? Our calculator tracks your entire buy-sell-put-sell cycle in one place, showing exact income, assignment odds, and annual ROI.

The Problem: Wheel Strategy ROI is Hidden

1
Fragmented Across Three Separate Trades — CC leg, CSP leg, result scattered
2
Total Income is Invisible — You don't know if the cycle was profitable
3
Assignment Timing Ruins Your Plan — Early assignment changes everything
4
Can't Compare to Buy-and-Hold — Did you beat just holding stock?
5
No Pattern Recognition — Which tickers perform best? Which DTEs work?

The Solution: Wheel Strategy Calculator

Single View of All Three Trades

Total Cycle Income and ROI

Assignment Probability for Each Leg

Buy-and-Hold Comparison

Pattern Recognition Across Cycles

Optimization Suggestions

Plan Your Wheel Cycle

Wheel Strategy Income Planner

Project your income over time with the wheel strategy (selling puts + calls)

Total Income in 6 Months
$3,900
$650/month average = 16% annual yield
Per Cycle
$975
Total Cycles
~4
Month-by-Month Income
Month 1Selling Puts
+$659Total: $659
Month 2Selling Calls
+$699Total: $1,358
Month 3Selling Puts
+$614Total: $1,972
Month 4Selling Calls
+$687Total: $2,659
Month 5Selling Puts
+$620Total: $3,279
Month 6Selling Calls
+$612Total: $3,891
How the Wheel Works
1.Sell cash-secured put to collect premium
2.If assigned to own shares at discount
3.Sell covered call to collect more premium
4.Repeat cycle to compound income over time
Find AAPL Options in Strategy Analyzer
Income compounds over time as you reinvest premiums into more contracts

Find Wheel-Ready Opportunities

Loading strategy analyzer…

How It Works

1

Enter Your Starting Position

Ticker, shares owned, purchase price, current price

2

Log Your Covered Call

Strike sold, premium, DTE, and outcome (assigned or expired)

3

Log Your Cash-Secured Put

Strike sold, premium, DTE, and outcome (assigned or expired)

Real Example: Complete AAPL Wheel Cycle

Entry: Bought 100 shares at $220

Leg 1 - Covered Call

  • Sold $245 strike call
  • Collected: $250
  • Outcome: Assigned (stock to $248)

Leg 2 - Cash-Secured Put

  • Sold $240 strike put
  • Collected: $200
  • Outcome: Assigned (stock fell to $238)

Cycle Results:

  • Total Income: $450
  • Capital Invested: $24,500
  • Cycle Duration: 42 days
  • Cycle ROI: 1.84%
  • Annualized ROI: 16%

Key Metrics

Total Cycle Income

$450

Cycle Duration

42 days

Cycle ROI

1.84%

Annualized ROI

16%

Related Resources

Wheel Strategy Complete DTE Playbook

Comprehensive DTE-focused guide for wheel strategy mastery

Wheel Strategy Review

In-depth review and optimization techniques

Wheel Strategy PDF Download

Offline reference guide for the wheel strategy

Wheel Strategy Explained

Complete beginner guide to the wheel strategy

Frequently Asked Questions

What's the wheel strategy?

Buy shares to Sell covered call (collect premium) to Get assigned (sell shares at profit) to Sell cash-secured put (collect premium) to Get assigned (buy shares back at lower price) to Repeat.

Why use the wheel strategy?

Income generation (2 premiums per cycle), acquisition advantage (earn premium when buying), defined risk, and disciplined execution.

How often does the wheel complete?

Typically 6-12 weeks per full cycle, depending on DTE selections and assignment timing.

Can the wheel fail?

Yes, if CC expires worthless (stock crashes) or CSP expires worthless (stock rallies). The calculator shows when these outcomes reduce total cycle ROI.

What's the best DTE for wheel strategy?

Weeklies (7 DTE): Higher annualized ROI, more cycles/year, but more admin work. Monthlies (30 DTE): Simpler, better premiums, less admin.

Ready to Get Started?

Join traders who are already using our tools to make better decisions.