
A poor man's covered call vs traditional covered call comparison shows why the PMCC strategy appeals to traders with limited capital. A PMCC uses a long-term call option instead of owning 100 shares outright. Both generate income by selling short-dated calls, but the PMCC needs less capital upfront and offers higher ROI potential, while carrying greater time-decay and delta risk.
Enter the Poor Man's Covered Call (PMCC): buy a long-dated call (90-180 DTE), sell short-dated calls against it. Same income, 90% less capital required.
But it's not a free lunch. Let me walk you through both strategies, their mechanics, and exactly when to use each one.
Compare strategies: Our Strategy Analyzer shows covered call opportunities across multiple stocks. Use it to compare traditional covered call premiums before deciding on a PMCC approach.
The Setup: Traditional Covered Call vs PMCC
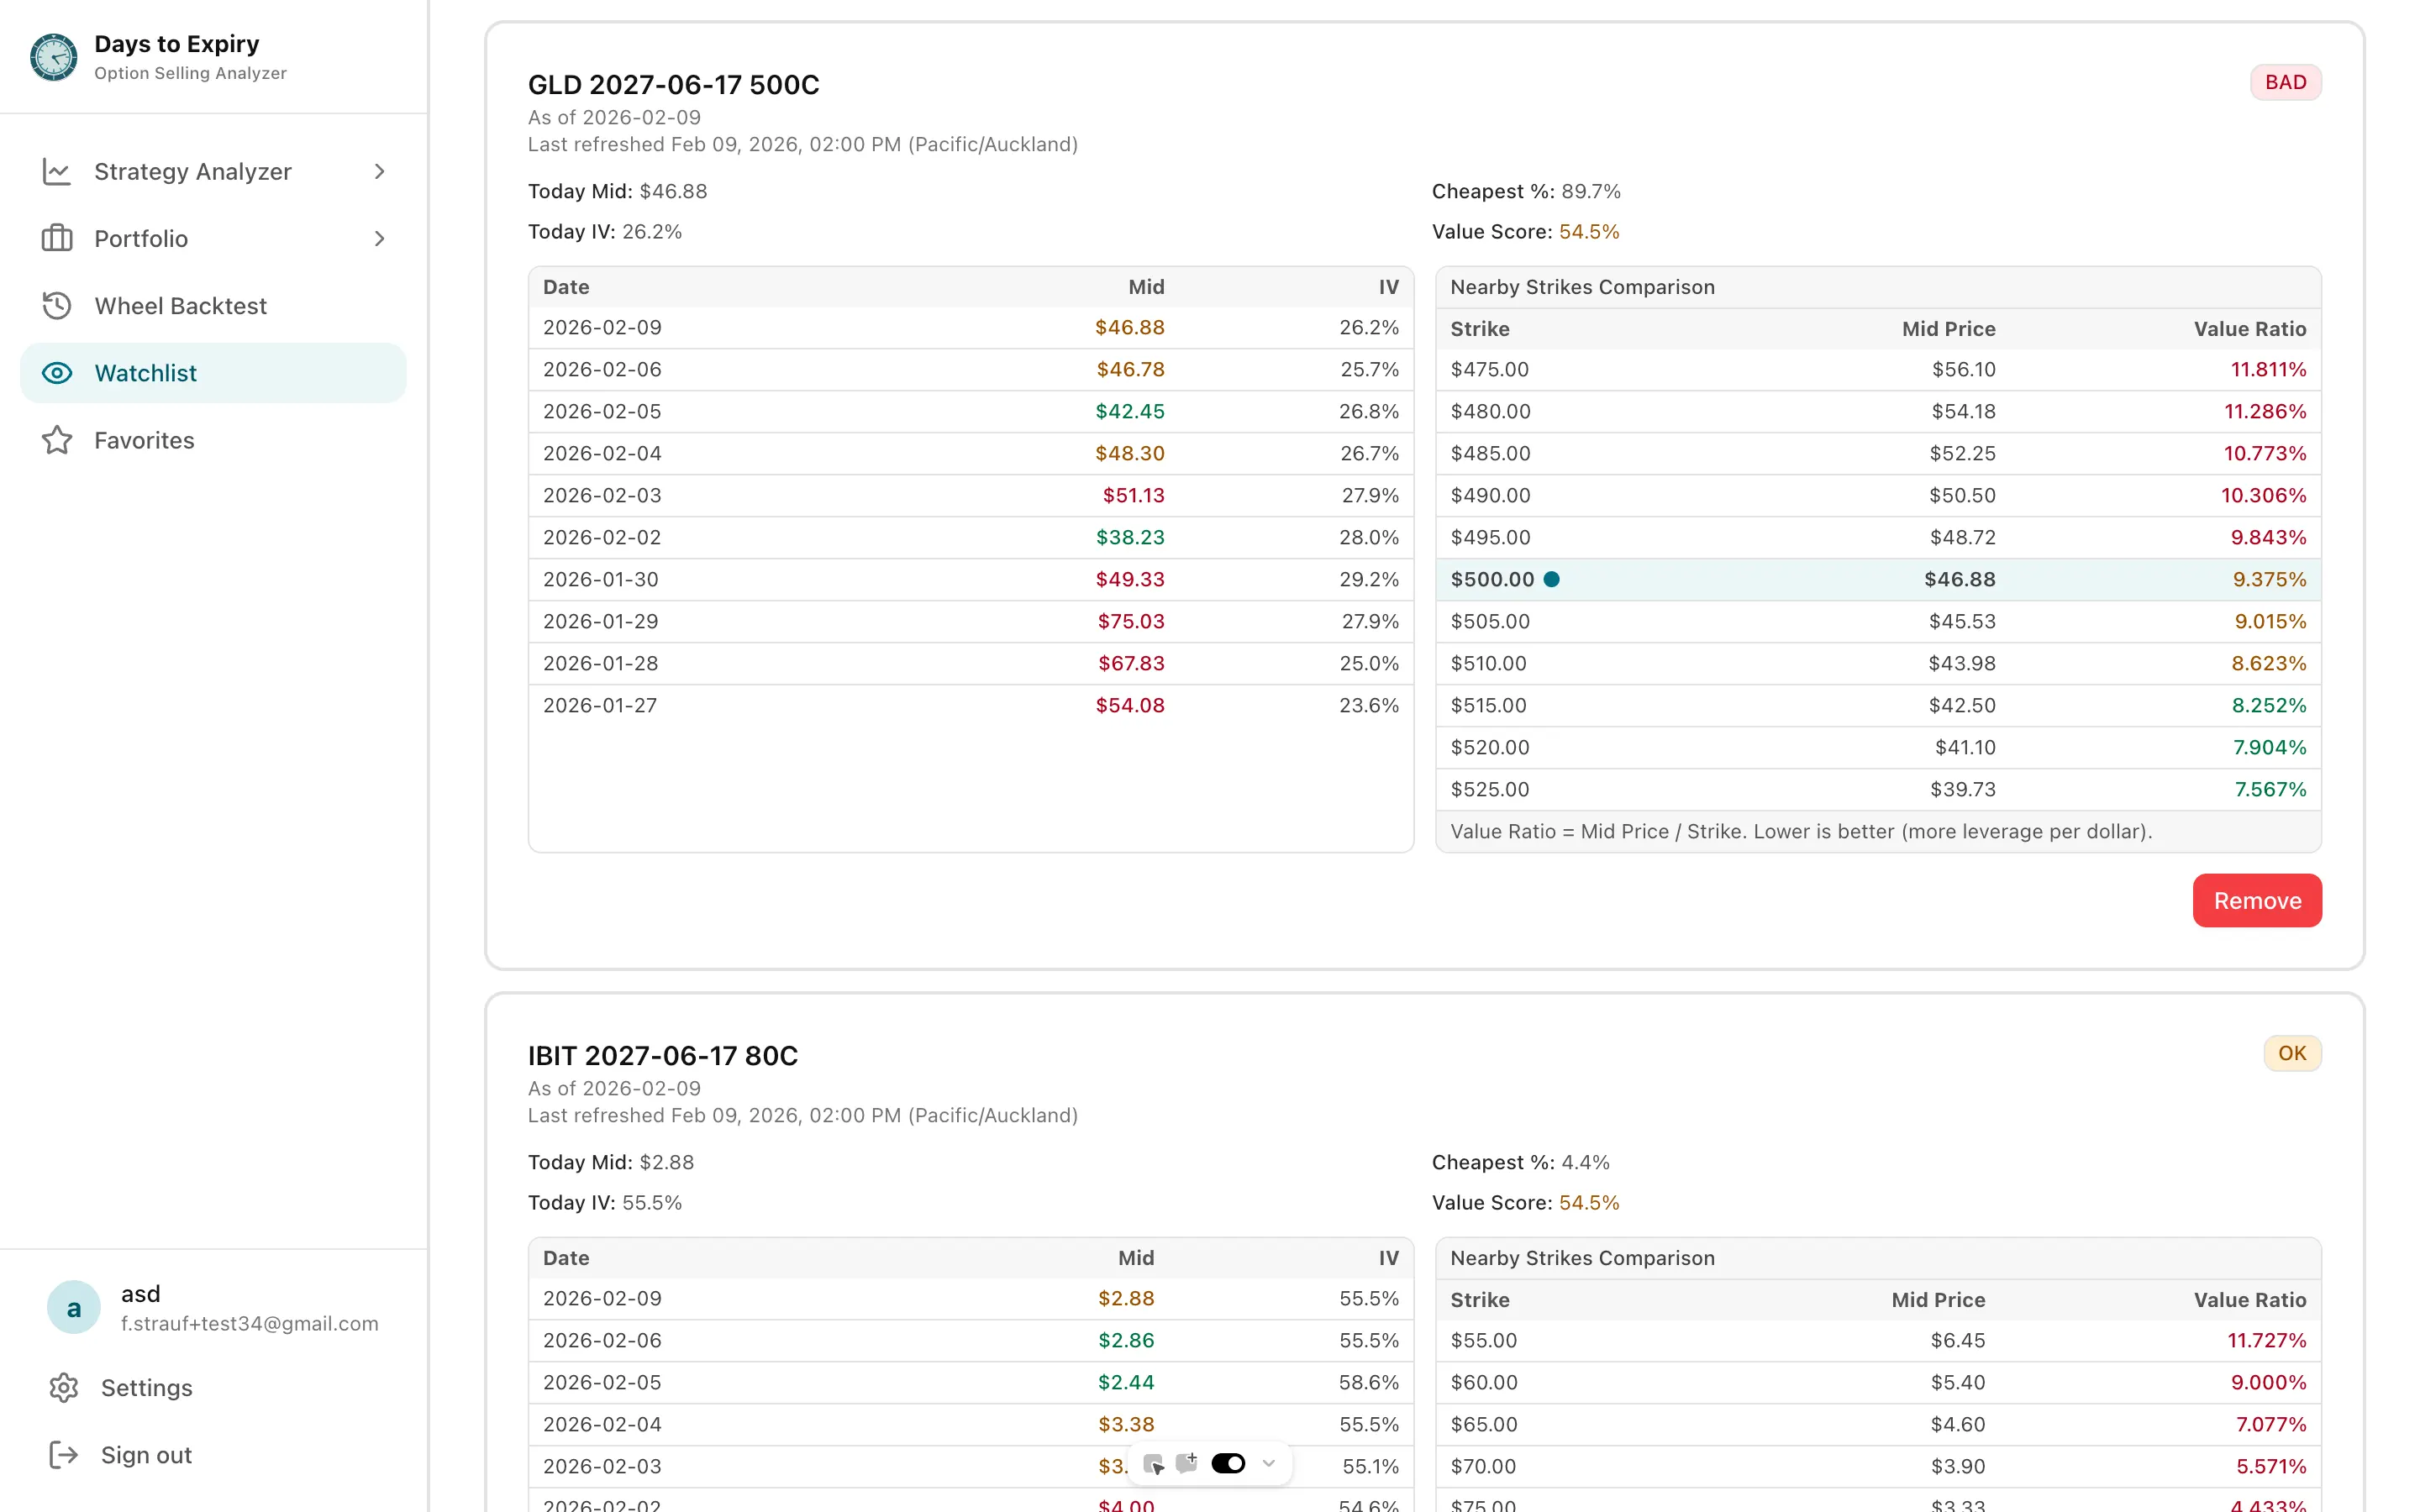 LEAPS portfolio management dashboard and PMCC position structure
Traditional Covered Call
- Buy 100 shares at market price (e.g., $200 = $20,000)
- Sell one OTM call 30-45 DTE (e.g., $205 strike)
- Collect premium from the call (e.g., $2 = $200)
- Capital at risk: Full share price ($20,000)
ROI on capital: ($200 premium / $20,000) = 1% per month, or ~12% annually
Poor Man's Covered Call (PMCC)
- Buy one 90-180 DTE ATM call (e.g., $200 strike) for $5-8 (cost = $500-800)
- Sell one 30-45 DTE OTM call against it (e.g., $205 strike) for $2 (credit = $200)
- Net cost: $300-600 initial capital
- Capital at risk: Only the debit spread cost (~$500-800)
ROI on capital: ($200 premium / $500 initial) = 40% per month, or ~400%+ annually*
*The annual number is misleading—you're recycling capital monthly, not compounding.
The Real Comparison: By Market Condition
Let's test both strategies in three realistic scenarios. Stock: $200, selling 30 DTE calls.
Scenario 1: Stock stays flat to slightly up (Most Common)
Traditional Covered Call:
- Buy 100 shares @ $200 = -$20,000
- Sell $205 call (30 DTE) = +$200
- Stock expires at $202
- Assignment doesn't occur (call expires worthless)
- Net: $200 profit, $20,000 tied up for 30 days
- ROI: 1%
PMCC:
- Buy $200 call (180 DTE) @ $7 = -$700
- Sell $205 call (30 DTE) @ $2 = +$200
- Cost basis: $500
- Stock expires at $202
- Call expires worthless, long call still worth ~$4
- Net: $200 credit + $400 long call value (locked until expiration) = $600 value created
- Realized ROI this cycle: $200 profit on $500 risk = 40%
Winner: PMCC by capital efficiency. PMCC also maintains optionality—you can keep selling calls on the long call repeatedly.
Scenario 2: Stock rallies hard (Bullish Move)
Stock rallies from $200 to $215 by 30 DTE expiration.
Traditional Covered Call:
- Buy 100 shares @ $200 = -$20,000
- Sell $205 call @ $2 = +$200
- Assignment at $205 (capped gain)
- Net: $500 profit (200-stock gain + 200-premium, minus $200 capped gain) = $500
- Effective profit: $500 on $20,000 = 2.5%
- Regret: You missed $1,000 of upside ($200 to $215, then assigned at $205)
PMCC:
- Buy $200 call (180 DTE) @ $7 = -$700
- Sell $205 call (30 DTE) @ $2 = +$200
- Stock rallies to $215
- Short $205 call assigned, but you exercise long $200 call
- Net: You're assigned on short call at $205, you own 100 shares (via long call exercise) at $200 effective cost
- Net: $500 profit (assigned at $205 on your short, cost of $200 on your long)
- But: Your long call is deep ITM and still has 150 DTE of theta decay
- Total realized: $500 + remaining long call value (~$1,500 of $200 call at $215 stock) = You can close for profit
Winner: PMCC, because you can capture the tail-end of the rally if the stock stays elevated. The long call retains value.
Scenario 3: Stock crashes (Bearish Move)
Stock drops from $200 to $185 by 30 DTE expiration.
Traditional Covered Call:
- Buy 100 shares @ $200 = -$20,000
- Sell $205 call @ $2 = +$200
- Stock crashes to $185, no assignment
- Stock loss: -$1,500
- Premium collected: +$200
- Net: -$1,300 loss
- Account damage: 6.5% on your covered position
PMCC:
- Buy $200 call (180 DTE) @ $7 = -$700
- Sell $205 call (30 DTE) @ $2 = +$200
- Remaining capital at risk: $500 debit
- Stock crashes to $185
- Short call expires worthless (great), but long call now worth ~$0.50 (from $7)
- Net: $200 credit - $650 loss on long call = -$450 realized loss
- Account damage: 90% loss on deployed capital, but absolute $ loss is only $450 vs. $1,300
Winner: PMCC, because your absolute loss is much smaller. But your percentage loss looks worse (90% vs. 6.5%), which is psychologically harder.
Capital Requirements Breakdown
If you have a $10,000 account:
Traditional Covered Calls:
- Can run ONE position on a $100 stock (1 contract = 100 shares = $10,000)
- Can run ZERO positions on a $200 stock (would exceed account)
- Efficiency: 100% of capital tied up in one position
PMCC:
- Can run 10-15 positions on the same $10,000 account
- Each position uses $500-700 (a $200 stock long call debit)
- Efficiency: Deploy capital to 10-15 income streams
The math: PMCC lets you diversify while staying fully deployed. Traditional covered calls force you into concentration risk or leave capital idle.
Risk Profile Comparison
Traditional Covered Call Risks
- Unlimited downside (minus premium collected) if the stock crashes
- Capped upside if the stock rallies past your short strike
- Assignment drag: If assigned, you own 100 shares of a stock that's rallied hard, forcing you to wait for it to come back down
- Capital lock: $20,000 tied up for 1% gain is painful if markets move elsewhere
PMCC Risks
- Long call decay: Your long call loses theta every day. If the stock stalls, you bleed theta on your long position
- Pin risk: At expiration, stock lands exactly on your short strike, creating assignment ambiguity
- Whipsaw risk: If stock drops hard, your long call loses value (even though it's "insurance"), then you have to decide whether to keep selling or exit
- Complexity: Two moving parts (long + short calls). Easier to make mistakes
Key difference: Traditional covered calls have known, linear risk (you lose 1:1 on downside). PMCCs have nonlinear risk (theta decay on long call vs. premium collection on short call—they move at different rates).
When to Use Each Strategy
Use Traditional Covered Calls if:
- You have substantial capital ($20k+) and want simplicity
- You own shares already and want to generate income on them
- You're not concerned about capital efficiency (your account is larger than your positions)
- You're bullish long-term on the stock (willing to hold if assigned)
- You like receiving dividends (covered call positions often include divvies; PMCC doesn't)
Use PMCC if:
- You have limited capital (<$10-15k total account)
- You want to run 10+ income streams without concentration risk
- You're directionally bullish but want to cap exposure
- You prefer % returns (40-100% per cycle) over absolute dollar gains ($200-400)
- You can handle complexity (managing long + short expirations)
Tax Implications
Traditional Covered Calls
- If assigned: You sell shares at the call strike. Gain/loss = (assignment price - original share cost)
- If not assigned: Premium is short-term capital gain (or long-term if you hold the shares 1+ year, it's integrated)
- Simpler: One transaction = one tax lot
PMCC
- Assignment: Long call gets exercised (no tax event), short call assigned (triggers a sale at your short strike)
- Closing: If you close both at once, two separate transactions = more tax lot complexity
- Complexity: May need to track basis on long call separately
For most traders, PMCC creates slightly more bookkeeping but doesn't materially change tax treatment (both are short-term gains/losses if held <1 year).
Call Premium Income, Month by Month
See how short-call credits accumulate across the year in a live demo portfolio.
Income Calendar
Option cash in/out by the month each fill settled
Connect your broker and see your own income calendar — every credit and buyback, month by month.
The Bottom Line: Which Should You Use?
PMCC Wins On:
- Capital efficiency (90% less capital for same income stream)
- Diversification (more positions per account)
- Scalability (lower barrier to entry)
Covered Calls Win On:
- Simplicity (own stock, sell calls, done)
- Dividend income (PMCC doesn't capture dividends)
- Psychological comfort (no theta decay anxiety on long call)
My recommendation: Start with covered calls on 1-2 stocks you already own or are bullish on. Once you've run them for a few months and understand the rhythm, add 3-5 PMCC positions on stocks you're neutral on (just want premium from).
The two strategies aren't mutually exclusive. A balanced income approach might be:
- 50% of capital in covered calls (simplicity, dividends, familiarity)
- 50% of capital in PMCCs (efficiency, diversification, % return focus)
This hybrid approach gives you the best of both worlds: proven income from covered calls, plus capital efficiency and diversification from PMCCs.
Poor Man's Covered Call vs Traditional Covered Call
- Poor Man's Covered Call: Capital-Efficient Income Strategy - Complete PMCC setup and execution guide
- Covered Calls by Expiration: Weekly vs Monthly Income Comparison - Deep dive on covered call DTE optimization
- Cash-Secured Puts vs Covered Calls: Income & Risk Comparison - Compare CSPs and covered calls
- The Wheel Strategy: Complete DTE-Optimized Guide - Combine both strategies systematically
- Options Greeks Explained: Income Trader's Guide - Understand delta and theta for covered call management
- Delta Neutral Options Strategy: Income Without Directional Risk
- Best Covered Call ETFs for 2026: Yield vs Risk Analysis
Expertise: By Sarah Chen, CFA — 12+ years options trading experience. View full bio and track record.
Ready to implement these strategies? Open your Option Alpha account and backtest poor man's covered call vs traditional covered calls with our free simulator.
Related Articles
- Covered Call ETF vs Manual
- Cash-Secured Puts vs Covered Calls: Income & Risk Comparison
- Best Stocks for Poor Man's Covered Call (2025)
- Best Stocks for Poor Man's Covered Call: 2025 LEAPS Screening Guide
- Selling Covered Calls for Income: Step-by-Step Strategy
- LEAPS Options Strategy: 2026 PMCC & LEAPS Barbell Playbook
Expertise: Written by the Days to Expiry Trading Team, options strategy specialists with 10+ years of trading experience.
Frequently Asked Questions
Written by Days to Expiry Trading Team
The Days to Expiry trading team brings together experienced options traders and financial analysts dedicated to helping investors generate consistent income through proven options strategies.
Continue Your Journey
Covered Call Analyzer
Find the best covered call opportunities.
Cash-Secured Put Calculator
Calculate put selling returns.
Demo Portfolio
Explore a sample portfolio with positions and strategy insights — no login required.
Wheel Strategy Calculator
Plan your wheel trades.
Free trial
Start free — then keep the full workflow
- Multi‑stock covered call and cash‑secured put scans
- Strategy backtesting for covered calls and puts
- Full wheel backtesting with buy‑and‑hold comparison
- AI Portfolio Scanner for advanced recommendations