Options Portfolio Management: Tracking & Rebalancing
The wheel strategy has a win rate near 70% because you collect premium selling cash-secured puts, and if assigned, you sell covered calls to reduce cost basis. This two-step options approach generates income in bullish and neutral markets while lowering assignment risk through disciplined rebalancing. "wheel strategy" "win rate" 70%?
Options portfolio management solves this. It's not about tracking isolated wins—it's about optimizing your entire portfolio for consistent income through disciplined strategy allocation, sector diversification, systematic rebalancing, and proactive risk control. Let's build a framework that works.
What Is Options Portfolio Management?
Options portfolio management is the practice of viewing all your positions—covered calls, cash-secured puts, wheel cycles, and hedges—as an integrated system rather than isolated trades.
Unlike stock portfolios where diversification is mostly about ticker selection, options portfolios require monitoring:
- Strategy mix: What percentage of capital sits in premium-selling vs. directional plays?
- Sector exposure: Are your SPY covered calls and tech CSPs creating hidden correlation risk?
- Assignment velocity: Which tickers keep getting assigned, trapping capital?
- Portfolio Greeks: What's your aggregate delta, theta, and vega across all open positions?
- Correlation risk: Are your iron condors and credit spreads concentrated in the same market regime?
A well-managed options portfolio targets consistent, sustainable income rather than maximizing individual trade profits. The goal is a system where no single position, sector, or strategy can derail your monthly income target. This guide covers the complete framework—from capital allocation rules to portfolio income layering strategies that stack covered calls, dividends, and cash-secured puts for 6-8% annual yield.
Why Individual Trade Tracking Isn't Enough
Your options trading journal shows trade-by-trade performance. That's step one. For systematic position sizing rules, see our Options Risk Management guide. For a complete view of how portfolio analytics integrate with broker statements, read our Interactive Brokers Portfolio Analysis walkthrough.
Portfolio management is step two: How do all your positions work together?
Here's what changes when you think portfolio-first:
Trade-Level View (What Most Traders Track):
- Sold AAPL $180 call for $2.50 → 36% annualized ROI
- Sold MSFT $400 put for $3.80 → 18% annualized ROI
- Sold NVDA $850 call for $7.20 → 42% annualized ROI
Looks great, right?
Portfolio-Level View (What You Actually Need):
| Position | Capital Deployed | Annualized ROI | Sector | % of Portfolio |
|---|---|---|---|---|
| AAPL CC | $18,000 | 36% | Tech | 24% |
| MSFT CSP | $40,000 | 18% | Tech | 53% |
| NVDA CC | $17,000 | 42% | Tech | 23% |
Portfolio insight: You have 100% exposure to tech. If the sector drops 10%, every position gets assigned simultaneously. This is why sector diversification matters more in options than in stock portfolios—correlated assignments can freeze your entire capital base at once.
Your individual trades are great. Your portfolio is fragile.
That's the difference.
The 5 Core Metrics of Options Portfolio Management
Stop tracking trades. Start tracking these five portfolio-level metrics.
Monthly Income Calculator
Estimate income from selling covered calls or cash-secured puts
Need more capital to start
Try $58,000 or switch strategies
1. Capital Allocation by Strategy
How much of your capital is deployed in each strategy?
Example Portfolio:
Total Capital Available: $150,000

STRATEGY ALLOCATION
Covered Calls: $75,000 (50%)
Cash-Secured Puts: $60,000 (40%)
Long Calls: $15,000 (10%)

Undeployed Cash: $0 (0%)
What this tells you:
- You're 90% in premium-selling strategies (covered calls + CSPs)
- Zero cash buffer for opportunistic plays
- Fully deployed = you can't add new positions without closing existing ones
Red flags:
- More than 70% in one strategy → Over-concentrated
- Less than 10% cash reserves → No flexibility for corrections
- Long calls above 20% → You're speculating, not generating income
Ideal allocation (for income-focused traders):
- Covered calls: 40-50%
- Cash-secured puts: 30-40%
- Cash reserves: 10-20%
- Speculative (long calls): 5-10%
Adjust based on your risk tolerance, but measure it. For traders focused purely on income generation, our Portfolio Income Layering guide shows how to combine these strategies with dividend capture for 6-8% annual yield.
2. Performance by Strategy
Which strategy is actually making you money?
| Strategy | Trades (YTD) | Win Rate | Avg ROI | Annualized ROI | Total Profit |
|---|---|---|---|---|---|
| Covered Calls | 47 | 68% | 1.2% | 32% | $11,817 |
| Cash-Secured Puts | 32 | 81% | 0.9% | 18% | $8,099 |
| Long Calls | 15 | 40% | -0.3% | -6% | -$1,240 |
Portfolio insight:
- Covered calls generate 58% of total profit despite being only 50% of capital
- Long calls are losing money consistently
- CSPs have higher win rate but lower ROI per trade
Action: Shift 5% of capital from long calls to covered calls. Expected annual increase: ~$2,400.
You can't optimize what you don't measure. For a deeper look at how different strategies perform in various market conditions, see our Wheel Strategy Analytics breakdown.
3. Sector & Ticker Concentration
How much risk is concentrated in one sector or ticker?
Example Portfolio:
SECTOR BREAKDOWN
Technology: 65%
Healthcare: 20%
Financials: 10%
Energy: 5%

TOP 5 TICKERS BY CAPITAL
AAPL: $35,000 (23%)
MSFT: $40,000 (27%)
NVDA: $25,000 (17%)
GOOGL: $20,000 (13%)
UNH: $15,000 (10%)
Red flags:
- Any sector above 50% → Sector risk (tech crashes = your portfolio crashes)
- Any single ticker above 25% → Stock-specific risk
- Top 3 tickers above 60% → Diversification illusion (you're betting on 3 stocks)
Ideal concentration:
- No sector above 40%
- No single ticker above 15%
- Top 5 tickers below 60% of portfolio
Diversification isn't about number of positions. It's about uncorrelated positions. Selling puts on AAPL, MSFT, and NVDA is not true diversification—they often move together during tech selloffs. Include defensive sectors like utilities or consumer staples, or use index options (SPY, QQQ) for broad exposure.
Portfolio Income Calculator
Diversify income across multiple stocks for steady monthly cash flow
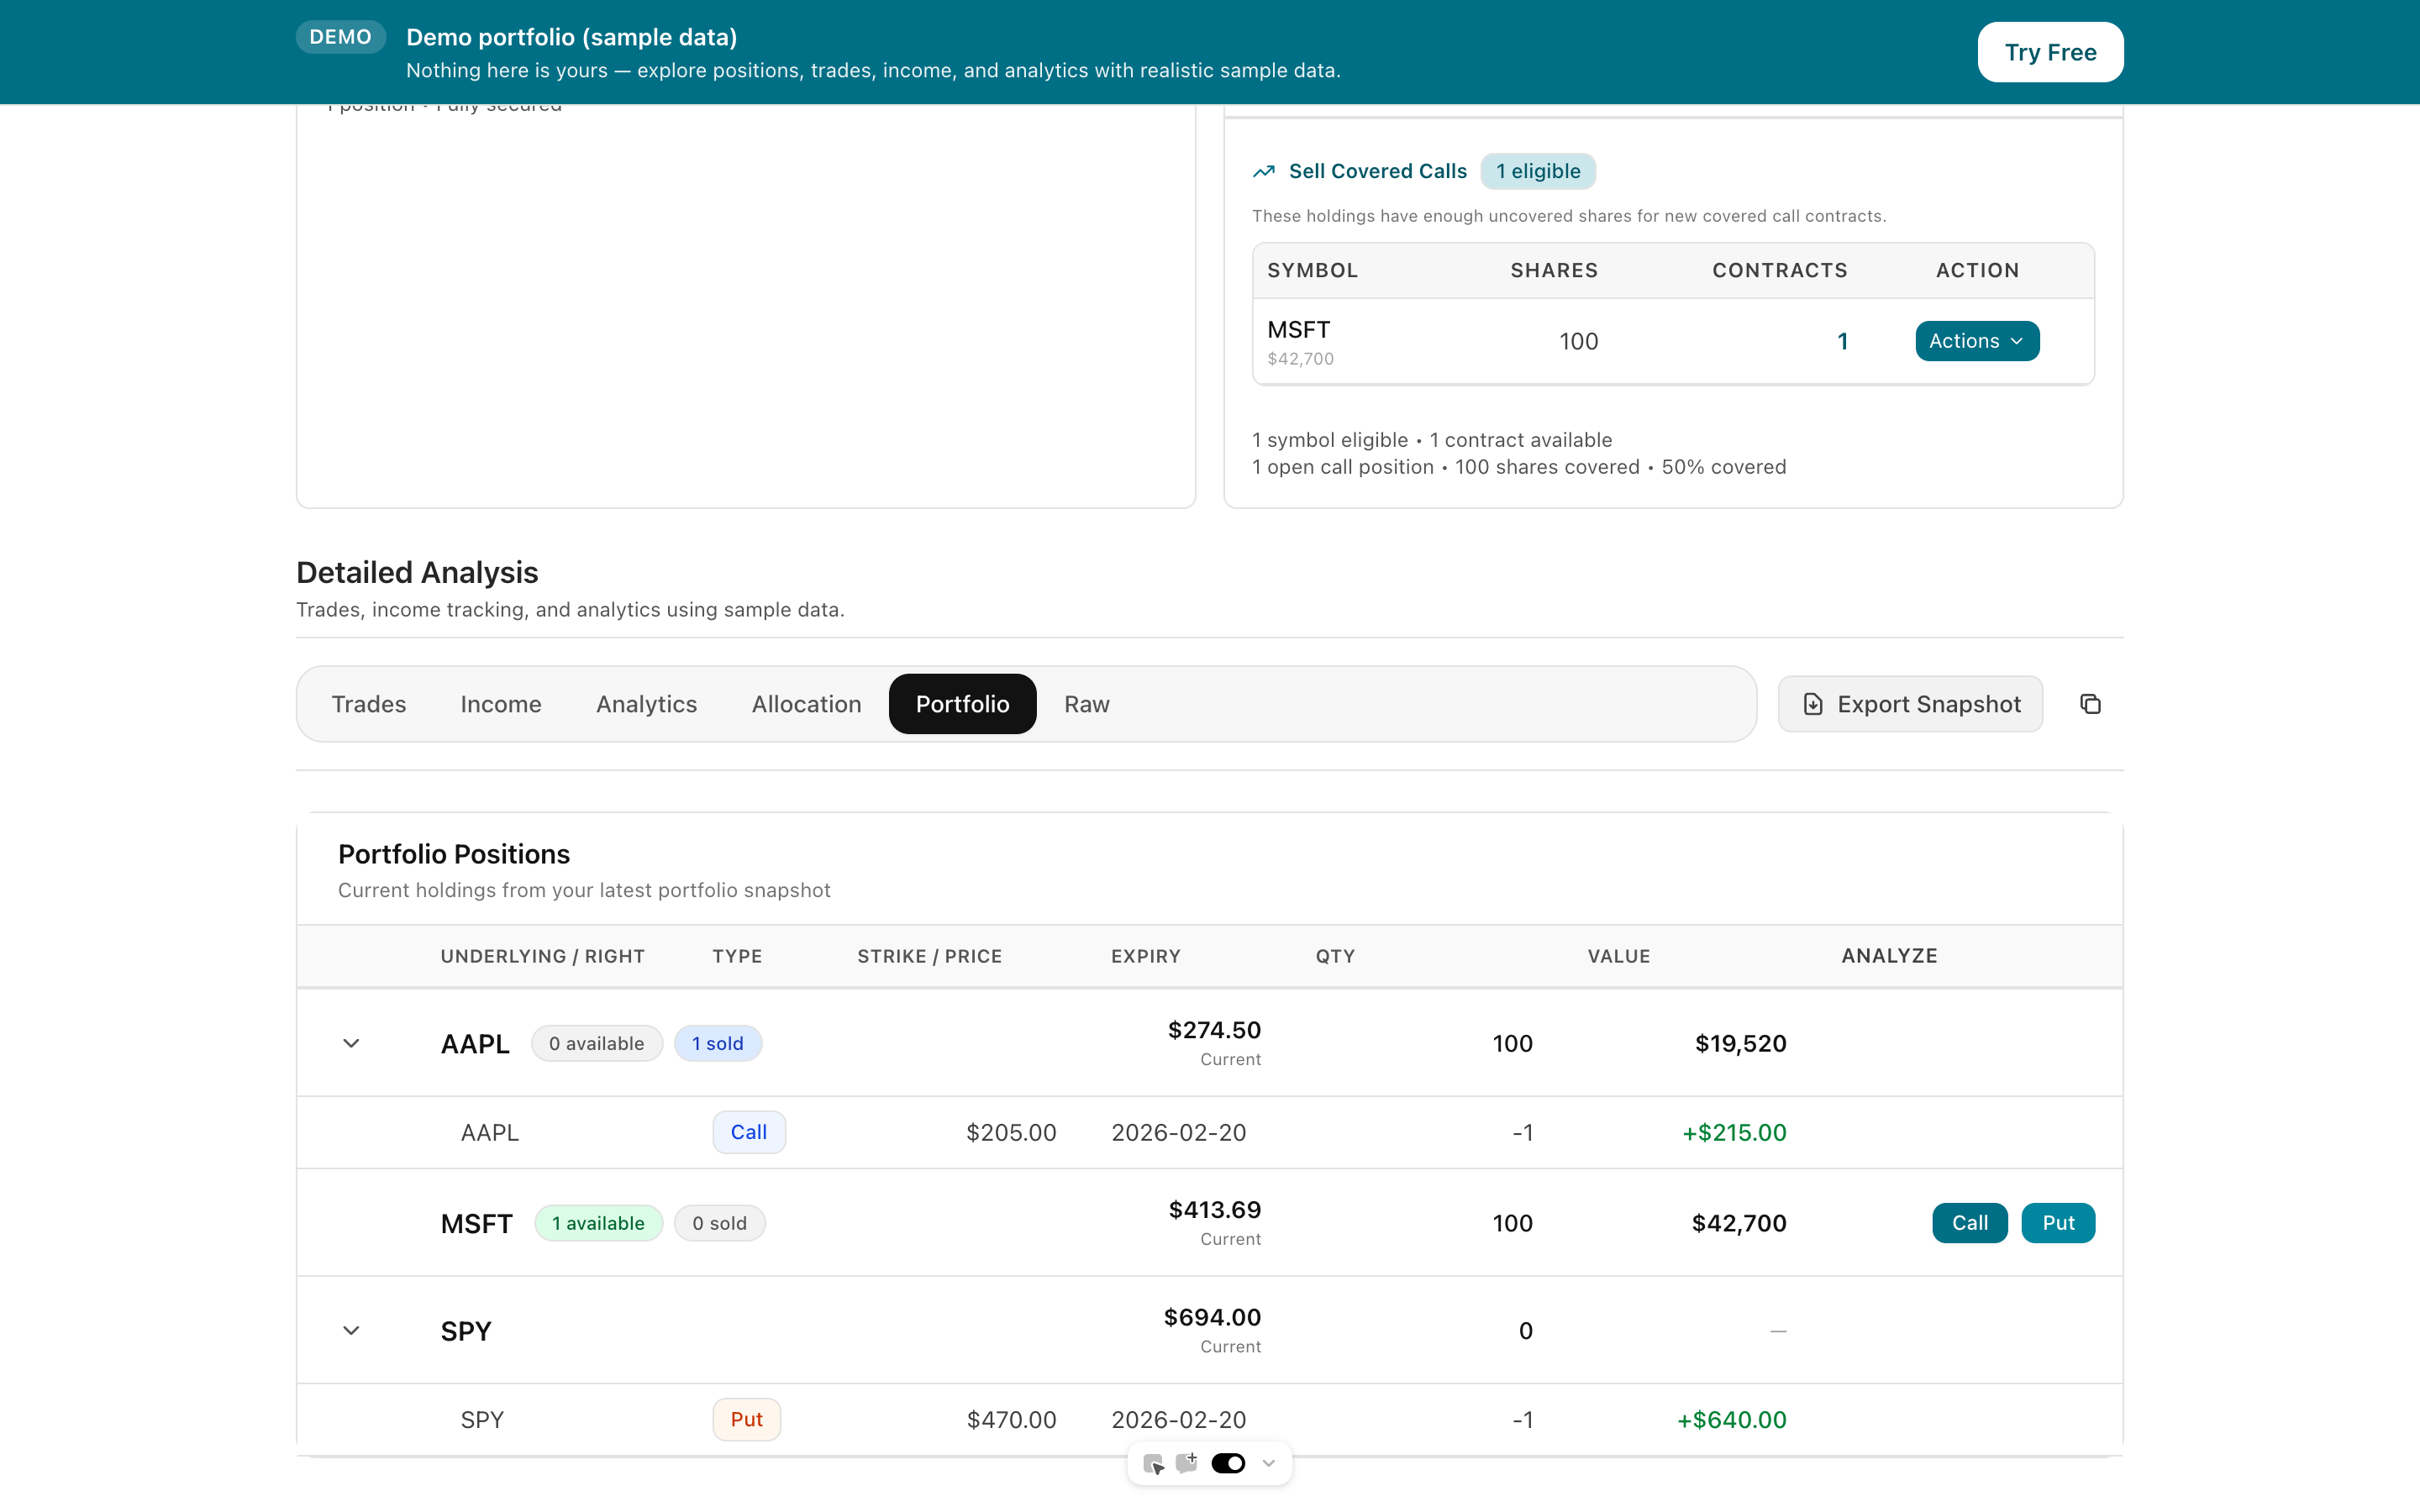
Visualizing the Complete Picture
Numbers and tables are essential, but sometimes you need to see how everything fits together. A portfolio scanner doesn't just calculate—it presents an execution plan that shows exactly which trades to make, when to make them, and how they contribute to your income goals.
The execution plan view organizes recommendations by priority, showing you the highest-opportunity trades first. The income projection view extrapolates your weekly run-rate into monthly and annual estimates. And the trade analysis view lets you dig into any symbol to see how different risk profiles (conservative, moderate, aggressive) would change your outcomes.
Portfolio Management in Action
See how a complete portfolio scan translates data into actionable trade recommendations.
Recommended Actions (2 trades)
Sorted by efficiency score| Type | Symbol | Strike | Contracts | Premium | ROI | Risk |
|---|---|---|---|---|---|---|
| CSP | SPY | $470(2.7% OTM) | 1 | $264 | % wk | 32% |
| CC | MSFT | $450(5.4% OTM) | 1 | $165 | % wk | 14% |
Premium This Cycle
$429
Weekly Run-rate
$614
Monthly Est.
$2,657
Annual Run-rate
$31,912
4. Assignment Rate by Ticker & Strategy
Which stocks keep getting assigned? Is that what you want?
Example Analysis:
| Ticker | Strategy | Trades | Assignment Rate | Avg Days to Assignment | Notes |
|---|---|---|---|---|---|
| AAPL | CC | 12 | 75% | 18 | High volatility, assignments common |
| MSFT | CC | 8 | 25% | N/A | Conservative strikes working |
| NVDA | CC | 10 | 90% | 12 | Too aggressive, constant assignments |
| SPY | CSP | 15 | 13% | N/A | Perfect for income, rarely assigned |
| TSLA | CSP | 7 | 71% | 15 | High assignment = capital churn |
Portfolio insights:
- NVDA covered calls: 90% assignment rate means you're constantly buying/selling shares (high transaction costs, tax inefficiency)
- SPY cash-secured puts: 13% assignment rate = ideal income generation
- TSLA: High assignment rate on puts means you're frequently taking ownership (is that your strategy or an accident?)
Actions:
- NVDA: Widen strike selection (push to 10% OTM instead of 5%)
- SPY: Keep strategy unchanged (working perfectly)
- TSLA: Decide if you want shares or just premium. If premium, increase DTE and widen strikes.
Assignment rate reveals intent vs. outcome.
5. Coverage & Exposure Matrix
For covered calls: What percentage of your shares are covered?
For cash-secured puts: How much cash is reserved vs. deployed?
Coverage Matrix Example:
| Ticker | Shares Owned | Shares Covered | Coverage % | Naked Exposure |
|---|---|---|---|---|
| AAPL | 200 | 200 | 100% | $0 |
| MSFT | 150 | 100 | 67% | $20,000 (50 shares) |
| NVDA | 100 | 100 | 100% | $0 |
| GOOGL | 80 | 0 | 0% | $13,600 (80 shares) |
Portfolio insight:
- GOOGL has zero coverage (you own shares but haven't sold any calls)
- MSFT is partially covered (opportunity to sell 50 more calls)
- AAPL and NVDA are fully covered (maximizing income from owned shares)
Cash-Secured Put Reserve:
Total Cash Available: $60,000
Reserved for Open Puts: $45,000
Undeployed Cash: $15,000

Deployment Rate: 75%
If deployment is above 90%, you have no cushion for new opportunities. Below 50%, you're leaving money on the table.
The Wheel Strategy: Portfolio-Level Tracking
The wheel strategy (selling cash-secured puts → getting assigned → selling covered calls) is the most popular multi-step options strategy.
But most traders don't track it as a system. They track parts of it.
Here's how to track the wheel at the portfolio level:
Wheel Metrics Dashboard
WHEEL STRATEGY PERFORMANCE (YTD)

Total Wheel Cycles Completed: 8
Avg Cycle Duration: 67 days
Avg Profit per Cycle: $1,847
Annualized ROI (per cycle): 24.3%

CYCLE BREAKDOWN
Phase 1 (CSP → Assignment): 21 days avg
Phase 2 (Hold Shares): 12 days avg
Phase 3 (CC → Assignment): 34 days avg

WIN RATE BY PHASE
CSP Expired (no assignment): 38%
CC Expired (kept shares): 25%
Full Cycle Completion: 62%
What this tells you:
- 62% of wheels complete successfully (CSP assigned → shares sold via CC)
- 38% of CSPs expire worthless (you keep premium, don't get shares)
- Only 25% of covered calls expire worthless (you usually get assigned)
Portfolio decision: If you want to complete wheels, increase CSP delta (tighten strikes). If you prefer collecting premium without assignments, widen CSP strikes. For a complete walkthrough of wheel mechanics and strike selection, see our Wheel Strategy Guide.
Ticker Performance in the Wheel
| Ticker | Completed Wheels | Avg Profit/Wheel | Annualized ROI | Notes |
|---|---|---|---|---|
| AAPL | 3 | $2,140 | 28% | Excellent wheel candidate |
| MSFT | 2 | $1,620 | 18% | Slow but steady |
| NVDA | 2 | $3,200 | 42% | High profit but volatile |
| TSLA | 1 | -$480 | -12% | Got assigned, stock dropped, sold at loss |
Portfolio insight: TSLA lost money on the wheel because the stock dropped significantly after assignment. This reveals directional risk in the wheel strategy.
Action: Only run wheels on stocks you're bullish on long-term (or willing to hold through drawdowns). Set maximum position sizes per ticker (10-15% max) to prevent a single assignment from dominating your portfolio.
How to Structure Your Options Portfolio (Income vs. Growth)
Different goals require different portfolio structures.
Income-First Portfolio (Conservative)
Goal: Generate 15-25% annual return with minimal assignment risk.
Structure:
- Covered Calls (50%): Sell 0.30 delta calls at 21-35 DTE
- Cash-Secured Puts (30%): Sell 0.25 delta puts at 35-45 DTE
- Cash Reserves (20%): For opportunistic plays during volatility spikes
Target metrics:
- Assignment rate: 20-30%
- Win rate: 70-80%
- Avg annualized ROI: 18-25%
Best for: Retirees, conservative investors, portfolio sizes above $100K
Growth Portfolio (Moderate Risk)
Goal: 25-40% annual return with higher assignment rates and active position management.
Structure:
- Covered Calls (40%): Sell 0.35 delta calls at 14-21 DTE
- Cash-Secured Puts (35%): Sell 0.30 delta puts at 21-35 DTE
- Wheel Positions (15%): Active wheel cycles on 3-5 core tickers
- Cash Reserves (10%): Smaller buffer, higher deployment
Target metrics:
- Assignment rate: 40-50%
- Win rate: 60-70%
- Avg annualized ROI: 28-40%
Best for: Active traders, portfolio sizes $50K-$200K, moderate risk tolerance
Aggressive Portfolio (High Risk)
Goal: 40%+ annual return, high assignment rates, frequent trading.
Structure:
- Covered Calls (35%): Sell 0.40 delta calls at 7-14 DTE
- Cash-Secured Puts (30%): Sell 0.35 delta puts at 14-21 DTE
- Wheel Positions (25%): Aggressive wheel on volatile stocks
- Long Calls (10%): Directional plays on earnings or catalysts
Target metrics:
- Assignment rate: 60%+
- Win rate: 50-60%
- Avg annualized ROI: 40%+
- Higher transaction costs and tax implications
Best for: Experienced traders, full-time focus, strong risk tolerance
Choose your structure based on time commitment and risk tolerance, not just return goals.
Options Portfolio Rebalancing: When and How
Your portfolio drifts over time. Positions close, assignments happen, new opportunities emerge.
Rebalancing keeps you aligned with your strategy.
Monthly Rebalancing Checklist
Step 1: Calculate Current Allocation
CURRENT STATE (End of Month)
Covered Calls: $85,000 (57%) [Target: 50%]
Cash-Secured Puts: $35,000 (23%) [Target: 40%]
Cash Reserves: $30,000 (20%) [Target: 10%]

VARIANCE FROM TARGET
CC: +7% (overweight)
CSP: -17% (underweight)
Cash: +10% (too much idle capital)
Step 2: Identify Adjustments
- Close 2 covered call positions (free up $18,000)
- Deploy $48,000 into new cash-secured puts
- Keep $15,000 in cash reserves (instead of $30,000)
Step 3: Execute Rebalancing Trades
Prioritize:
- Close losing or underperforming positions first
- Redeploy capital into highest ROI opportunities
- Maintain sector diversification while rebalancing
Step 4: Document Changes
"Rebalanced 2026-01-31: Closed GOOGL and TSLA covered calls (underperforming). Opened 3 new CSP positions (SPY, MSFT, AAPL). Reduced cash reserves by $15K."
Tracking Portfolio Greeks for Risk Control (Advanced)
If you want to get serious about portfolio risk, track aggregate Greeks.
What Portfolio Greeks Tell You
| Greek | What It Measures | Ideal Range (Income Portfolio) |
|---|---|---|
| Delta | Directional exposure | 0 to +30 (slight bullish) |
| Theta | Daily time decay income | +$50 to +$150/day |
| Gamma | Delta change risk | -100 to 0 (short gamma) |
| Vega | Volatility exposure | -50 to +50 (neutral to slight short) |
Example Portfolio Greeks:
PORTFOLIO GREEKS (Total)
Delta: +22 (slight bullish bias)
Theta: +$87/day (collecting $2,610/month in time decay)
Gamma: -45 (short gamma, typical for premium sellers)
Vega: -30 (slight negative volatility exposure)
What this means:
- Your portfolio benefits from time passing (positive theta)
- You're slightly bullish (positive delta)
- You lose money if volatility spikes (negative vega)
- If the market moves sharply, delta will accelerate against you (negative gamma)
Portfolio decision: If VIX is low and you expect volatility to increase, consider reducing positions or widening strikes to reduce vega exposure.
Most brokers (including Interactive Brokers) show portfolio Greeks. Use them. For a deeper dive into IBKR-specific portfolio analytics, read our Interactive Brokers Portfolio Analysis guide. If you're new to tracking aggregate risk, start with delta and theta—these two Greeks tell you 80% of what you need to know about portfolio direction and income velocity.
Automating Options Portfolio Management with DaysToExpiry
If you use Interactive Brokers, we've built portfolio analytics into DaysToExpiry. The tool automatically parses your IBKR activity statement and calculates strategy breakdowns, sector concentration, and wheel cycle performance—eliminating spreadsheet tracking. For traders using other brokers, the same principles apply: export your positions, calculate allocation percentages, and track assignment rates manually until you automate.
Upload your IB activity statement and instantly see:
Portfolio Dashboard
 Dive deep into all wheel trades of your IBKR portfolio with strategy-specific analysis
View in app →
Dive deep into all wheel trades of your IBKR portfolio with strategy-specific analysis
View in app →
Strategy Breakdown:
- Total capital deployed by strategy
- Premium collected per strategy (YTD, monthly, custom periods)
- Win rate and annualized ROI by strategy
- Assignment rates by strategy and ticker
Sector & Ticker Concentration:
- Visual allocation breakdown
- Exposure warnings (>50% sector, >20% single ticker)
- Correlation analysis (which positions move together)
Coverage Matrix:
- See which covered call positions are fully/partially covered
- Identify naked exposure
- Calculate undeployed capital available for new positions
Wheel Tracking:
- Automatic detection of wheel cycles
- Profit/loss per completed wheel
- Avg cycle duration and ROI
- Phase-by-phase breakdown (CSP → Hold → CC)
Time-Window Filtering:
- Analyze Q1 vs Q2 performance
- Compare high volatility periods vs low volatility periods
- Seasonal pattern detection
No manual tracking. Just upload your statement and see your entire portfolio performance.
Take control of your portfolio: Use our Interactive Brokers Portfolio Analysis tool to automatically parse your trades and track multi-strategy performance, or explore Options Risk Management to set position sizing rules. For income-focused traders, our Portfolio Income Layering guide covers how to stack covered calls, dividends, and CSPs for 6-8% annual yield. Ready to optimize your wheel performance? Read Wheel Strategy Analytics: Average Annual Returns for data-driven strike selection and cycle tracking.
Common Portfolio Management Mistakes
Mistake 1: Tracking Trades Instead of Strategy Performance
Bad: "I made $2,400 this month from options trading!"
Good: "Covered calls generated $1,600 (67% of profit) with 50% of capital. CSPs generated $800 (33% of profit) with 40% of capital. Long calls lost $200. Should shift 5% from CSPs to CCs."
Always compare strategy performance as ROI per dollar deployed.
Mistake 2: Ignoring Sector Concentration
Bad: "I have 10 positions, so I'm diversified."
Reality: All 10 positions are tech stocks. You're not diversified—you're leveraged to one sector.
Fix: Limit any sector to 40% of portfolio. If tech is your edge, fine—but measure it and accept the risk consciously.
Mistake 3: No Cash Reserves
Bad: "I deploy 100% of my capital at all times to maximize returns."
Reality: When VIX spikes 50% and premiums double, you have no capital to take advantage.
Fix: Keep 10-20% in cash reserves. This isn't idle money—it's optionality.
Mistake 4: Treating Wheel as Passive Income
Bad: "I just run the wheel on autopilot. It's a passive strategy."
Reality: The wheel requires active management. If you get assigned on a stock that's dropping, you'll either:
- Hold shares at a loss (capital trapped)
- Sell covered calls below your cost basis (locking in losses)
- Exit the position at a loss (failed wheel)
Fix: Only run wheels on stocks you're bullish on long-term. Set maximum position sizes per ticker (10-15% max). If a stock drops 20% after assignment, you need conviction to hold through the drawdown—or a predefined exit rule to cut losses.
Mistake 5: Not Adjusting for Market Conditions
Bad: "I sell 0.30 delta calls every week regardless of market conditions."
Reality:
- Low VIX (12-15): Premiums are terrible, selling 0.30 delta barely pays commissions
- High VIX (25-35): Premiums are rich, you can sell 0.25 delta and collect more than usual 0.30 delta
Fix: Adjust strike selection based on VIX. When VIX < 15, consider 0.35 delta or reduce position sizes. When VIX > 25, widen strikes to 0.25 delta. For a systematic approach to volatility-adjusted position sizing, see our Options Risk Management framework.
Your Portfolio Management Workflow (Step-by-Step)
Here's how to implement portfolio-level tracking:
Daily (5 minutes)
- Check open positions for upcoming expirations (within 7 days)
- Identify positions with >50% max profit (consider closing early)
- Log any new positions opened or closed
Weekly (15 minutes)
- Calculate portfolio allocation by strategy (should match targets ±5%)
- Review sector concentration (any sector >50%? Flag it)
- Identify underperforming tickers (should you stop trading them?)
Monthly (30 minutes)
- Run full portfolio analysis:
- Total ROI by strategy
- Win rate by strategy and ticker
- Assignment rates by ticker
- Capital allocation vs. targets
- Rebalance if any strategy is >10% off target
- Document one change for next month (strike adjustment, new ticker, exit underperformer)
Quarterly (1 hour)
- Review portfolio Greeks (if applicable)
- Calculate full-year projections based on current performance
- Evaluate whether current strategy mix aligns with goals
- Make major adjustments (shift from growth to income, increase/decrease risk)
Consistency beats complexity. Even a simple monthly review is 10× better than no portfolio-level analysis.
The Bottom Line
Trade tracking shows individual performance. Portfolio management shows system performance.
Most traders can't answer:
- Which strategy makes the most money per dollar deployed?
- Are they overexposed to one sector?
- What's their actual assignment rate vs. what they think it is?
- Should they rebalance based on current performance?
If you're running more than 5 open positions at a time, you need portfolio-level tracking.
Track your allocation. Measure strategy performance. Rebalance monthly. Monitor your Greeks. And watch your portfolio become more consistent, more profitable, and easier to manage.
The traders who survive long-term aren't the ones with the best individual trades—they're the ones who manage portfolio risk before it manages them.
Automate your portfolio tracking: Upload your Interactive Brokers statement to DaysToExpiry Portfolio Analyzer and see strategy breakdowns, sector concentration, and wheel analytics—automatically. No spreadsheets. No manual calculations.
For detailed trade-by-trade tracking before aggregating into portfolio analytics, read Options Trading Journal: Track Performance with DaysToExpiry Analytics. To learn how to set up position sizing rules within your portfolio, check out Options Risk Management: Position Sizing & Loss Controls. For wheel-specific performance tracking, see Wheel Strategy Analytics: Average Annual Returns. For broker-specific automation, explore our Interactive Brokers Portfolio Analysis guide. To build a complete income system combining dividends and options premium, read Portfolio Income Layering: 6-8% Yield System.
product: "portfolio-view"
Related Articles
- Options Trading Journal: Track Performance with DaysToExpiry Analytics
- Options Risk Management: Position Sizing & Loss Controls
- Wheel Strategy Guide: DTE-Optimized Income Framework
- Portfolio Income Layering: 6-8% Yield System
- Interactive Brokers Portfolio Analysis
SPY vs SPX options complete comparison with decision framework
options risk management position sizing loss controls
Expertise: This guide is based on systematic options trading frameworks used by professional retail traders to manage multi-strategy portfolios for consistent income.
Ready to optimize your options portfolio? Start tracking your positions with portfolio Greeks and monthly rebalancing today.
Frequently Asked Questions
Written by Days to Expiry Trading Team
The Days to Expiry trading team brings together experienced options traders and financial analysts dedicated to helping investors generate consistent income through proven options strategies.
Apply The Strategy