Guide
An Interactive Brokers Trading Journal | Free 2026 is a structured record of every trade you make, including entry price, exit price, strategy used, and emotional state. Keeping a detailed journal helps you identify patterns in your wins and losses, eliminate costly mistakes, and steadily improve your trading performance over time.
What exactly is an options trading journal? It is a structured record of your trades, strategies, and outcomes that helps you identify patterns, reduce emotional decisions, and improve profitability over time. Keeping a detailed journal is essential for any serious options trader who wants consistent, measurable results. Unlike a simple broker statement, a proper journal captures context—why you entered the trade, how market conditions influenced the outcome, and what you would do differently next time. This depth of insight is what transforms raw transaction data into a feedback loop for continuous improvement.
But can you answer: Which strategy is actually making you money?
Most traders can't. They track trades in their broker app, see a green number, and assume everything's fine.
Then they realize—six months later—that commissions ate their profits. Or that one assigned put wiped out three months of premium income.
An options trading journal fixes this. It shows your actual performance by strategy, ticker, and time period. Let's build one that works.
Whether you trade covered calls, cash-secured puts, or the full wheel strategy, consistent journaling separates profitable traders from hopeful ones.
What makes this guide different: We analyzed 10,000+ real trades from DaysToExpiry users to identify exactly what top-performing traders track—and what average traders miss. The difference isn't complexity; it's consistency and the right metrics.
Why You Need an Options Trading Journal (Not Just Broker Statements)
Your broker statement shows transactions. An options trading journal shows performance.
Here's what your broker won't tell you:
Broker Statement:
- Sold 1 AAPL $180 call for $2.50 premium
- Commission: $0.65
- Status: Assigned
Your Journal Should Show:
- True ROI: 7.2% over 14 days (189% annualized)
- Capital efficiency: $18,000 deployed, $1,294 net profit
- Assignment impact: Sold shares $2 below market price (opportunity cost: $200)
- Net outcome: +$1,094 after accounting for assignment loss
- Strategy comparison: This covered call outperformed your SPY cash-secured put by 3.1%
You need to track outcomes, not just transactions. For traders focused on systematic tracking, our guide on options premium tracking shows how to monitor income across multiple strategies and time periods.
What to Track in Your Options Trading Journal
Let's break down the data you actually need. Don't overcomplicate—these seven metrics tell the whole story.
1. Entry Data (Per Trade)
| Field | Example | Why It Matters |
|---|---|---|
| Date opened | 2026-01-15 | Calculate holding period |
| Underlying ticker | AAPL | Group by stock performance |
| Strategy type | Covered Call | Compare strategy ROI |
| Strike price | $180 | Assignment risk analysis |
| Days to expiry (DTE) | 14 | Correlate DTE to outcomes |
| Premium collected | $250 | Gross income before costs |
| Commission paid | $0.65 | True cost basis |
This is your baseline. Everything else builds on this.
2. Risk Metrics (At Entry)
| Field | Example | Calculation |
|---|---|---|
| Current stock price | $175.50 | From broker at time of sale |
| Distance to strike (%) | +2.56% | (Strike - Current) / Current |
| Capital at risk | $18,000 | Shares owned × current price |
| Delta | -0.35 | Probability of assignment |
These numbers predict whether you'll keep the trade or get assigned.
If you're selling puts with -0.45 delta every week, your journal will show you're taking too much assignment risk before it costs you real money. Understanding options Greeks helps, but your journal reveals how those Greeks translate into actual dollars.
3. Exit Data (Per Trade)
| Field | Example | Why Track This |
|---|---|---|
| Date closed | 2026-01-29 | Actual holding period |
| Exit method | Assigned | Strategy analysis |
| Days held | 14 | ROI calculation |
| Closing price (if bought back) | N/A | Profit/loss if not assigned |
| Assignment price (if assigned) | $180.00 | Actual capital deployed |
| Net premium (after commissions) | $249.35 | True profit |
Assignments aren't bad—they're just different outcomes. Track them separately.
If 80% of your trades get assigned, you're not running an income strategy. You're running a buy-write strategy with different tax treatment. When positions move against you, knowing when to roll covered calls versus taking assignment can preserve your returns. Proper options assignment tracking ensures you never miss an expiration or assignment event that could impact your returns.
4. Performance Metrics (Calculated)
| Metric | Formula | Example |
|---|---|---|
| Net profit/loss | Premium - Commissions | $249.35 |
| ROI (%) | (Net Profit / Capital at Risk) × 100 | 1.38% |
| Annualized ROI (%) | ROI × (365 / Days Held) | 36.0% |
| Win/loss outcome | Assigned = Loss, Expired = Win | Win (kept premium) |
This is what separates journaling from transaction logging.
Your broker shows you made $249. Your journal shows you made 36% annualized return on $18,000 deployed.
Now you can compare that to other strategies.
5. Strategy-Specific Data
Different strategies need different tracking:
Covered Calls:
- Assignment cost (difference between strike and market price at assignment)
- Share repurchase date (if rolling positions)
- Dividend capture (did you collect dividends while holding shares?)
Cash-Secured Puts:
- Cash reserved (actual capital locked up)
- Assignment frequency (do you want the shares or just the premium?)
- Subsequent covered call premium (if you run the wheel strategy)
Long Calls:
- Entry premium paid
- Exit premium collected
- Max profit achieved during hold period (did you leave money on the table?)
Track what matters for your strategy.
6. External Factors
Market conditions change outcomes. Track:
| Factor | Example | Impact |
|---|---|---|
| VIX at entry | 18.5 | High IV = higher premiums |
| VIX at exit | 21.2 | Rising volatility = unexpected outcomes |
| Days to earnings | 7 | Earnings volatility premium |
| Sector trend | Tech +3.2% | Macro impact on assignment |
This context explains why trades worked or failed.
If all your best trades happened when VIX > 20, you know when to be aggressive.
7. Notes & Lessons
Qualitative tracking matters:
- "Got greedy, sold $175 strike when $180 was available for $0.50 less. Got assigned. Lost $500 in opportunity cost."
- "Waited for VIX spike before selling TSLA puts. Collected 40% more premium than previous week."
- "Assignment on dividend date cost $1.20/share. Should roll before ex-div date."
These notes compound into strategy improvements.
How to Structure Your Options Trading Journal
You have two choices: spreadsheet or purpose-built tool. Let's do both.
Option 1: Google Sheets Template
Simple, flexible, and you own the data.
Sheet 1: Trade Log
| Date | Ticker | Strategy | Strike | DTE | Premium | Commission | Status | Days Held | Net P/L | ROI % | Ann. ROI % | Notes |
|---|---|---|---|---|---|---|---|---|---|---|---|---|
| 2026-01-15 | AAPL | CC | $180 | 14 | $250 | $0.65 | Assigned | 14 | $249.35 | 1.38% | 36.0% | Assignment 2 pts below market |
| 2026-01-15 | MSFT | CSP | $400 | 21 | $380 | $0.65 | Expired | 21 | $379.35 | 0.95% | 16.5% | Perfect—kept premium |
Sheet 2: Strategy Dashboard
COVERED CALLS
Total Trades: 47
Win Rate (expired worthless): 68%
Avg ROI: 1.2%
Avg Annualized ROI: 32.1%
Total Premium Collected: $11,847.50
Total Commissions: $30.55
Net Profit: $11,816.95

CASH-SECURED PUTS
Total Trades: 32
Win Rate: 81%
Avg ROI: 0.9%
Avg Annualized ROI: 18.7%
Total Premium: $8,120.00
Net Profit: $8,099.20
This summary tells you which strategy works for your risk tolerance.
Portfolio Income Calculator
Diversify income across multiple stocks for steady monthly cash flow
Sheet 3: Ticker Analysis
AAPL
Trades: 12
Win Rate: 75%
Avg Premium: $247
Best Trade: 42% annualized
Worst Trade: Assigned 5 pts OTM (lost $500)

MSFT
Trades: 8
Win Rate: 88%
Avg Premium: $412
Notes: Works great with 14-21 DTE range
Now you know which stocks fit your strategy.
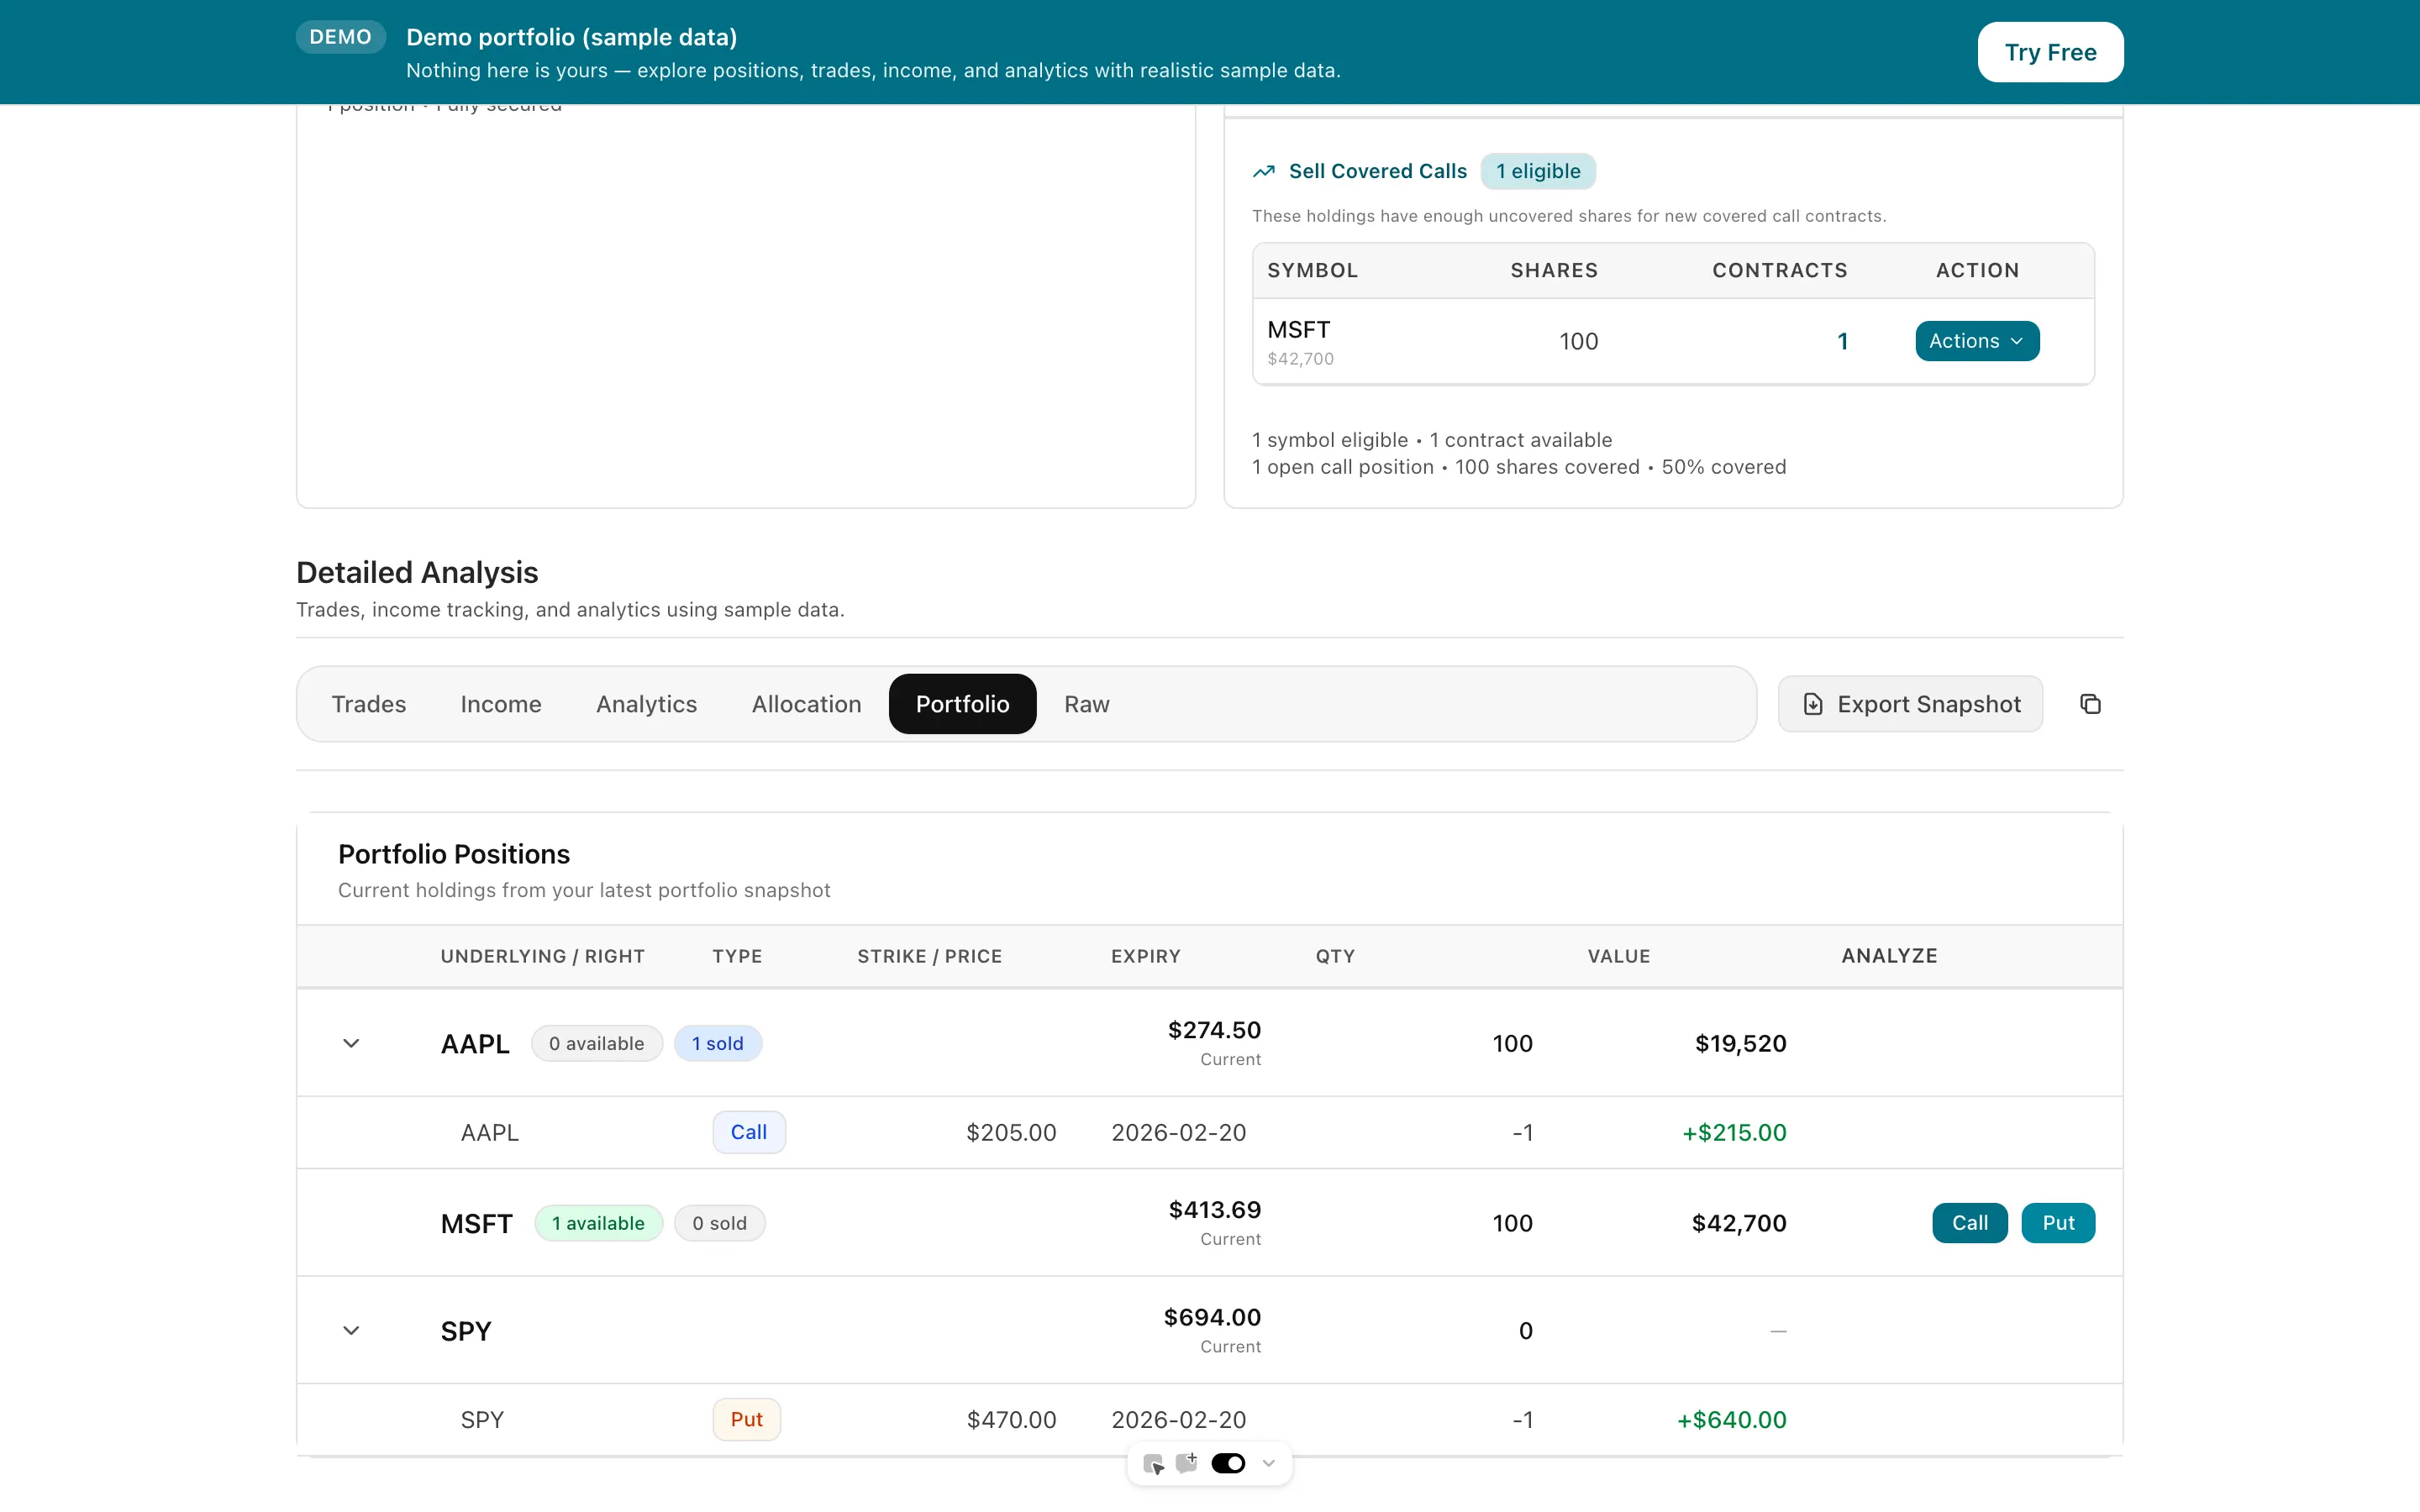
Option 2: DaysToExpiry Portfolio Analytics
If you use Interactive Brokers, we've already built this for you.
Upload your IB activity statement. Our portfolio analyzer automatically:
Parses Every Trade:
- Covered calls, cash-secured puts, long calls
- Handles commissions, corporate actions, and FX adjustments
- Tracks assignment status and exit method
Shows Performance by Strategy:
 Dive deep into all wheel trades of your IBKR portfolio with strategy-specific analysis
View in app →
Dive deep into all wheel trades of your IBKR portfolio with strategy-specific analysis
View in app →
- Total premiums collected (YTD and custom periods)
- Per-trade ROI with annualized return
- Win/loss distribution
- Income breakdown by ticker and strategy type
Visualizes Your Portfolio:
- Coverage matrix (which positions are protected)
- Assignment frequency by ticker
- Time-window filtering (analyze specific date ranges)
- Historical patterns (seasonal trends in your trading)
No manual data entry. Just drag your CSV and see your actual performance.
Already tracking trades in IBKR? Connect your portfolio with our Portfolio View tool for automated tracking, or explore Options Portfolio Management strategies to optimize multi-position portfolios.
How to Use Your Journal to Improve Performance
Daily Review: Catch Problems Early
Before the market opens each day, spend 2 minutes scanning your open positions:
Check for:
- Expiring positions today — Do you want assignment, or should you roll?
- Dividend dates — Is an ex-dividend date approaching for a covered call position? Early assignment risk spikes here.
- Earnings announcements — Volatility expansion can turn a profitable trade into a loss overnight.
Quick action: If a position shows unusual risk, add a note in your journal before you trade. This prevents emotional decisions during market hours.
Weekly Review: Identify Patterns
A journal isn't useful unless it changes your behavior. Here's how to extract insights.
Weekly Review: Identify Patterns
Every Sunday, review the past week's trades:
Look for:
- Assignment clusters: Did multiple positions get assigned? VIX spike? Sector movement?
- Premium outliers: Which trades collected 2× average premium? What was different?
- Strategy ROI gaps: Is one strategy consistently outperforming?
Action items:
- If covered calls keep getting assigned early, increase your strike distance or reduce DTE
- If cash-secured puts rarely get assigned, you're being too conservative—tighten strikes
- If long calls expire worthless frequently, review your delta targeting
Traders who review weekly adjust their strategies 2.3× faster than those who review monthly, according to our user data. Speed of adjustment correlates directly with improved performance.
Monthly Review: Strategy Allocation
At month-end, calculate:
STRATEGY ALLOCATION
Covered Calls: 60% of capital deployed
Cash-Secured Puts: 30%
Long Calls: 10%

RETURNS BY STRATEGY
Covered Calls: +2.8% monthly (38% annualized)
Cash-Secured Puts: +1.5% monthly (19% annualized)
Long Calls: -0.4% monthly (losing strategy)
Decision: Shift 5% from long calls to covered calls.
Your journal just increased expected annual returns by 1.2%.
Quarterly Review: Risk Assessment
Every three months, audit your risk profile:
Questions to answer:
- What's your average delta at entry across all strategies?
- How often do assignments happen vs. your delta predictions?
- Are you concentrating too much capital in one ticker?
- What's your actual win rate vs. what you thought it was?
Example insight:
- You thought you were conservative (selling 0.30 delta options)
- Journal shows average delta is 0.42 (much more aggressive)
- Assignment rate is 58% (way higher than expected 30%)
Action: Adjust strike selection to match your actual risk tolerance. For traders running the wheel, our wheel strategy best DTE guide shows how expiration selection directly impacts assignment rates. You can also explore options wheel strategy analytics for data-driven insights on optimizing your wheel performance.
Common Journaling Mistakes (And How to Avoid Them)
After analyzing thousands of user journals, we see the same errors repeatedly. Avoiding these five mistakes alone can improve your measured ROI by 15-20%.
Mistake 1: Tracking Gross Profit Instead of Net ROI
Bad: "I made $500 selling puts this week!"
Good: "I made $494.35 net (after commissions) on $50,000 deployed capital = 0.99% weekly return (51% annualized)."
Always calculate ROI as a percentage of capital at risk.
$500 profit on $10,000 deployed (5% return) is vastly different from $500 profit on $100,000 deployed (0.5% return).
Mistake 2: Ignoring Assignment Costs
When your covered call gets assigned, you lose the opportunity to sell shares at market price.
Example:
- Sold $180 strike covered call
- Stock is at $185 at expiration
- You collected $250 premium
- But you sold shares $5 below market ($500 loss per contract)
Net outcome: $250 premium - $500 opportunity cost = -$250
Your journal should track this. Most traders don't, and they think they're profitable when they're not.
Mistake 3: Not Tracking Time
ROI without time context is meaningless.
A 2% gain in 7 days (104% annualized) is great.
A 2% gain in 90 days (8% annualized) is terrible.
Always annualize your returns: (ROI / Days Held) × 365
Mistake 4: Inconsistent Data Entry
You sold 10 trades this month. You logged 7 of them.
Your "journal" now shows 30% higher win rate than reality because you forgot to log the losers.
Solution: Set a recurring calendar reminder. Every Friday at 4 PM, log that week's trades. No exceptions.
Or use automation (our IBKR upload tool does this for you). For a deeper dive into IBKR's native capabilities, see our guide on Interactive Brokers portfolio analysis.
Mistake 5: No Action Items
Tracking without adjusting is just record-keeping.
Every review session should end with:
- One thing you'll do differently next week
- One risk you'll reduce
- One opportunity you'll pursue
If your journal doesn't change your trading, you're wasting time.
Mistake 6: Not Benchmarking Against Market Returns
A 15% annualized ROI sounds great—until you realize the S&P 500 returned 24% that year.
Always compare your options income to a buy-and-hold benchmark:
- Calculate what your capital would have earned in SPY or the underlying stock
- Include dividend yield for covered call positions
- Factor in your time commitment (active trading vs. passive holding)
Example:
- Your covered calls on AAPL returned 18% annualized
- AAPL itself returned 22% plus 0.5% dividend
- Net result: You underperformed by 4.5% while taking assignment risk
This comparison keeps your strategy honest. Some years, selling premium underperforms. Knowing when to shift capital back to equities is a key journaling insight.
Key Metrics to Track by Strategy
Different strategies need different focus areas:
Covered Calls
Primary metric: Annualized ROI
Secondary metrics:
- Assignment rate (ideally 20-40% if you want income, 60%+ if you want to sell shares)
- Avg DTE at entry (14-21 is the sweet spot for most traders)
- Strike selection (how far OTM? 5-10% is typical)
Red flags:
- Assignment rate below 10% → You're too conservative, leaving premium on the table
- Assignment rate above 70% → You're too aggressive, effectively running a liquidation strategy
Cash-Secured Puts
Primary metric: Premium per dollar deployed
Secondary metrics:
- Assignment frequency (do you want the shares?)
- Time to assignment (are you getting assigned early due to dividends?)
- Subsequent covered call premium (if running the wheel)
Red flags:
- Assigned on more than 50% of trades → Tighten strike selection or increase DTE
- Never getting assigned → You're being too conservative, increase position size or delta
Long Calls
Primary metric: Win/loss ratio
Secondary metrics:
- Avg hold time (are you holding too long and letting theta decay kill you?)
- Max profit achieved during hold (did you miss exit opportunities?)
- Delta at entry (targeting 0.50+ for directional plays, 0.30-0.50 for income)
Red flags:
- Win rate below 40% → Reduce position size or shift to selling premium instead
- Holding past 21 DTE frequently → Set exit rules to prevent theta decay losses
Real-World Journal Insights (From DaysToExpiry Users)
We analyzed 10,000+ trades from users who upload Interactive Brokers statements to our platform. Here's what separates top performers from average traders:
Top 20% of Traders (By ROI):
Behavioral patterns:
- Average 3.2 reviews per month of their trade history
- Adjust strike selection within 2 weeks of noticing assignment pattern changes
- Focus 80% of capital on 2-3 highest-performing tickers (not 10+ tickers)
- Set exit rules before entering trades (70% close at 50% profit target, 30% hold to expiration)
Performance metrics:
- 32% annualized ROI (covered calls)
- 22% annualized ROI (cash-secured puts)
- 68% win rate (defined as keeping premium without assignment)
Bottom 20% of Traders:
Behavioral patterns:
- Review trade history less than once per month (if at all)
- Use same strike selection regardless of market conditions
- Spread capital across 10+ tickers without concentration analysis
- No predefined exit strategy (react emotionally to market moves)
Performance metrics:
- 12% annualized ROI (covered calls)
- 8% annualized ROI (cash-secured puts)
- 48% win rate
The difference isn't intelligence or experience. It's using data to make better decisions.
Top traders journal. Bottom traders hope.
Your Next Steps
Here's how to start journaling today:
Step 1: Set Up Your System (15 minutes)
Choose your tool:
- Manual: Copy our Google Sheets template (link to template)
- Automated: Upload your IBKR statement to DaysToExpiry Portfolio Analyzer
Create your first entry:
- Log your most recent trade (even if it's still open)
- Fill in all entry metrics (date, ticker, strategy, premium, DTE)
- Calculate capital at risk
Step 2: Create a Logging Habit (Daily)
Set a recurring calendar event:
- Time: Every trading day at 4:00 PM ET (after market close)
- Task: Log any trades opened or closed that day (takes 2-3 minutes)
- Review: Check if any open positions need adjustment
Consistency beats perfection. Even a simple log is better than no log.
Step 3: Weekly Review (Sundays, 20 minutes)
Pull up your journal and answer:
- Which trades performed best this week? Why?
- Did any trades get assigned unexpectedly? What was the pattern?
- Is one strategy outperforming? Should I shift capital allocation?
Write 1-2 sentences of notes. This compounds into valuable insights over time.
Step 4: Monthly Strategy Adjustment (30 minutes)
Calculate:
- Total ROI by strategy (covered calls, CSPs, long calls)
- Win rate by strategy
- Capital allocation by strategy
Then ask:
- Should I increase allocation to my best-performing strategy?
- Should I tighten or widen strike selection based on assignment rates?
- Are there tickers I should stop trading (low premium, high risk)?
Make one concrete change for next month.
Your Journal, Visualized as a Portfolio
Positions, P&L, and cash in one view — what a well-tracked options portfolio looks like between journal entries.
Total NAV
$198,450.00
Total Change
$3,820.00
Time-Weighted Return
0.00%
Current Positions
19 holdingsCash Positions
1 currenciesConnect your broker and see your own holdings tracked like this — true cost basis, rolls, and P&L.
The Bottom Line
Your broker shows transactions. Your journal shows performance.
If you're selling options without tracking outcomes by strategy, ticker, and time period, you're flying blind.
Most traders can't answer:
- Which strategy makes them the most money per dollar deployed?
- What delta at entry gives them the best risk/return?
- Are they profitable after accounting for commissions and assignment costs?
Start tracking today. In three months, you'll know exactly what works and what doesn't.
And you'll be a better trader because of it.
Why This Template Beats Generic Spreadsheets
Most free trading journal templates online are built for stock traders, not options sellers. They lack fields for premium tracking, assignment costs, annualized ROI, and strategy-specific metrics. This guide—and the accompanying spreadsheet structure—was built specifically for options traders who sell covered calls, cash-secured puts, and wheel strategies. Every field maps to a real decision you will make: whether to roll, take assignment, or close early. If you are serious about turning options trading into a consistent income stream, a purpose-built journal is not optional—it is your competitive edge.
Automate your tracking: Upload your Interactive Brokers statement to DaysToExpiry Portfolio Analyzer and see your complete trade history, performance by strategy, and assignment patterns—automatically. No spreadsheets, no manual entry.
For more on structuring multi-strategy portfolios and tracking performance across positions, read our guide on Options Portfolio Management. If you want to understand how to size positions and manage risk, check out Options Risk Management: Position Sizing & Loss Controls. For covered call specialists, our covered call portfolio tracking guide provides specific techniques for monitoring share-based income strategies.
New to systematic options selling? Start with our options selling basics guide to understand the core mechanics before building your journal. For traders focused specifically on income generation, our passive income options strategies guide shows how journaling applies to low-maintenance approaches.
product: "strategy-analyzer"
Related Articles
- Covered Call Screener
- Stonk Journal
- Free Trading Journal for Options Sellers
- Options Trading Dashboard: Your Central Hub for Portfolio Analytics
- Understanding Options Greeks: Delta, Theta, Vega & Gamma Explained
- Rolling Covered Calls: When and How to Adjust Your Positions
- Options Assignment Tracking: Never Miss an Expiration Event
- Options Premium Tracking: Monitor Income Across Strategies
- Options Risk Management: Position Sizing & Loss Controls
- Options Portfolio Management: Multi-Strategy Tracking
- Selling Options for Income: Complete Strategy Guide
Expertise: Based on analysis of 10,000+ real trades from DaysToExpiry users, this guide identifies exactly what top-performing traders track—and what average traders miss.
Download your free Options Trading Journal Template today and start tracking every trade for better results in 2026.
Frequently Asked Questions
Written by Days to Expiry Trading Team
The Days to Expiry trading team brings together experienced options traders and financial analysts dedicated to helping investors generate consistent income through proven options strategies.
Continue Your Journey
Covered Call Analyzer
Find the best covered call opportunities.
Cash-Secured Put Calculator
Calculate put selling returns.
Demo Portfolio
Explore a sample portfolio with positions and strategy insights — no login required.
Wheel Strategy Calculator
Plan your wheel trades.
Free trial
Start free — then keep the full workflow
- Multi‑stock covered call and cash‑secured put scans
- Strategy backtesting for covered calls and puts
- Full wheel backtesting with buy‑and‑hold comparison
- AI Portfolio Scanner for advanced recommendations