Average Annual Return Wheel Strategy: 15-30% Annual Returns in Options Trading
What is the average annual return for the wheel strategy in options trading? Investors typically earn 15% to 30% yearly by repeatedly selling cash-secured puts and covered calls on the same stock, making it ideal for income-focused investors seeking consistent cash flow.
- Sell cash-secured puts
- Get assigned
- Sell covered calls
- Get assigned
- Repeat
But most traders running the wheel can't answer basic questions:
- How many complete wheel cycles have you finished?
- What's your average profit per cycle?
- Which stocks work best for the wheel?
- Are you actually making money, or just churning capital?
The wheel isn't passive income. It's a multi-phase strategy that requires tracking, optimization, and portfolio-level analytics.
Let's fix that.
What Is the Wheel Strategy (In Plain English)
The wheel strategy combines two premium-selling strategies into one repeatable cycle:
Phase 1: Sell Cash-Secured Puts (CSP)
- You reserve cash and sell a put option
- You collect premium upfront
- Outcome A: Option expires worthless → You keep premium, start over
- Outcome B: Option gets assigned → You buy 100 shares, move to Phase 2
Phase 2: Sell Covered Calls (CC)
- You own shares from Phase 1 assignment
- You sell call options against those shares
- You collect premium upfront
- Outcome A: Option expires worthless → You keep shares + premium, sell another call
- Outcome B: Option gets assigned → Shares sold, return to Phase 1
The cycle "wheels" between selling puts and selling calls, collecting premium at every step.
Wheel Strategy Income Planner
Project your income over time with the wheel strategy (selling puts + calls)
Why the Wheel Works (The Math)
The wheel strategy has a structural advantage: You profit in most market scenarios.
Cash-Secured Put Phase (Phase 1)
| Market Movement | Outcome | Profit/Loss |
|---|---|---|
| Stock rises | Put expires worthless | Keep full premium ✓ |
| Stock stays flat | Put expires worthless | Keep full premium ✓ |
| Stock drops slightly | Put expires worthless | Keep full premium ✓ |
| Stock drops below strike | Get assigned | Effective cost = Strike - Premium ✓ |
| Stock crashes >20% | Get assigned at high price | Holding shares at loss ✗ |
You profit in 4 out of 5 scenarios.
Covered Call Phase (Phase 2)
| Market Movement | Outcome | Profit/Loss |
|---|---|---|
| Stock rises above strike | Shares called away | Premium + Capital gain ✓ |
| Stock stays flat | Call expires worthless | Keep premium + shares ✓ |
| Stock drops slightly | Call expires worthless | Keep premium + shares ✓ |
| Stock drops significantly | Call expires worthless | Shares down, premium offsets slightly ✗ |
You profit in 3 out of 4 scenarios.
Combined: The wheel wins in 7 out of 9 market scenarios.
The only major risk is holding shares during a prolonged downturn. We'll address that with stock selection and risk management.
How Market Conditions Affect the Wheel
The wheel strategy behaves differently depending on the broader market environment. In sideways or slowly grinding markets, cash-secured puts tend to expire worthless repeatedly, producing steady premium income without assignment. In bull markets, you may miss upside because your capital is reserved for potential assignment. Bear markets increase assignment frequency, which transitions you into the covered call phase on stocks bought at lower prices—though this only works if you selected durable underlyings. The strategy is most vulnerable during sharp, sudden crashes, where rapid price drops can force assignment on depreciating assets and leave you holding shares with little premium income to offset the decline. Matching your strike selection and position sizing to the current market regime is essential for consistent results.
The Discipline Advantage
The wheel's most underrated benefit is structural discipline. Because the strategy forces you into a mechanical cycle — sell put, collect premium, accept assignment, sell call — it removes the emotional decision-making that destroys most retail traders. You don't have to guess when to buy or when to sell; the strategy dictates your next move. This rules-based approach naturally prevents panic buying during rallies and panic selling during drawdowns, turning the wheel into a behavioral training system as much as an income strategy.
The Three Wheel Outcomes (And What They Mean)
Not all wheel cycles are created equal. There are three distinct outcomes, each with different profit profiles.
Outcome 1: CSP Expires Worthless (No Assignment)
What happens:
- You sell a cash-secured put
- Stock stays above strike
- Option expires worthless
- You keep premium and start over
Example:
- Stock at $185, sell $180 put for $2.80 ($280 premium)
- Stock stays at $187, option expires
- Profit: $280 (pure premium, no capital deployed beyond cash reserve)
ROI calculation:
- Capital reserved: $18,000 (strike × 100)
- Profit: $280
- Holding period: 30 days
- Monthly ROI: 1.56% | Annualized: 18.7%
This is the ideal outcome for pure income: You collect premium without ever owning shares, freeing capital to repeat immediately.
Outcome 2: Full Wheel Cycle (CSP Assignment → CC Assignment)
What happens:
- You sell CSP, get assigned (buy shares)
- You sell covered call on those shares
- Call gets assigned (shares sold)
- Cycle completes, you're back to cash
Example:
- Stock at $185, sell $180 CSP for $2.80 → Get assigned at $180
- Effective cost: $180 - $2.80 = $177.20
- Stock at $179, sell $182.50 CC for $2.30 → Get assigned at $182.50
- Shares sold at $182.50
Profit breakdown:
- CSP premium: $280
- CC premium: $230
- Capital gain: ($182.50 - $180) × 100 = $250
- Total profit: $760
ROI calculation:
- Capital deployed: $18,000 (purchase price of shares)
- Profit: $760
- Holding period: 60 days (30 days CSP + 30 days CC)
- Cycle ROI: 4.2% | Annualized: 25.6%
This is the classic wheel outcome: You profit from both premium collection and capital appreciation.
Outcome 3: Stuck Holding Shares (Failed Wheel)
What happens:
- You sell CSP, get assigned
- Stock drops significantly
- You sell covered calls, but they keep expiring worthless (stock below strikes)
- You're holding shares at a loss with limited premium collection
Example:
- Stock at $185, sell $180 CSP for $2.80 → Get assigned at $180
- Stock drops to $165 (down 8.3% from assignment)
- You sell $175 CC for $1.20 (below your cost basis)
- Call expires worthless, stock still at $165
Profit/Loss:
- CSP premium: $280
- CC premium: $120
- Unrealized loss: ($180 - $165) × 100 = -$1,500
- Net loss: -$1,100
This is the risk of the wheel: You're holding shares in a downtrend, and premium collection can't offset capital losses.
How to avoid: Only run the wheel on stocks you're bullish on long-term (or willing to hold through drawdowns).
Assignment Stress Test
Test your position under adverse market scenarios to understand assignment risk and potential losses.
Base Assignment Probability
30%
Premium Collected
$250
Maximum Loss
$14,250
Scenario Analysis
| Price Move | Final Price | Assignment Prob | P/L | Status |
|---|---|---|---|---|
| Current | $150.00 | 15% | $250 | Safe |
| -5% | $142.50 | 31.7% | $0 | Safe |
| -10% | $135.00 | 36.9% | $-750 | At Risk |
| -20% | $120.00 | 47.2% | $-2,250 | At Risk |
Break-even: $142.50 • Blue row shows current price scenario
Find real options with similar parameters
Crash Assignment Risk
The most severe wheel outcome is not routine assignment—it is assignment immediately preceding a major market drop. When this occurs, you are left holding shares that are falling fast, while the covered call premiums available on those shares collapse because volatility skew shifts and the underlying price is already depressed. You are effectively locked into a depreciated position with minimal income to offset the loss. This scenario highlights why conservative strike selection and diversification across sectors matter more than maximizing premium. Maintaining unallocated cash reserves allows you to continue selling puts on other names even when one position turns into a long-term recovery hold.
How to Track Wheel Performance (The Right Way)
Most traders track individual CSP and CC trades. That's wrong.
You need to track complete wheel cycles as single units.
Wheel Cycle Metrics (What to Measure)
| Metric | How to Calculate | Why It Matters |
|---|---|---|
| Cycle ID | Sequential (Cycle 1, 2, 3...) | Track individual cycles |
| Ticker | Stock symbol | Compare wheel performance by stock |
| Start Date | Date CSP was sold | Calculate cycle duration |
| End Date | Date CC was assigned (or cycle exited) | Measure holding period |
| Cycle Duration | Days from CSP sale to CC assignment | Optimize DTE targeting |
| CSP Premium | Premium collected from put sale | Track Phase 1 income |
| CC Premium(s) | Sum of all covered call premiums | Track Phase 2 income (multiple CCs possible) |
| Capital Gain/Loss | (CC strike - CSP strike) × 100 | Measure price appreciation capture |
| Total Profit | CSP + CC + Capital Gain | Absolute profit per cycle |
| Cycle ROI | (Total Profit / Capital Deployed) × 100 | Measure efficiency |
| Annualized ROI | (ROI / Days Held) × 365 | Compare across cycles |
Example Wheel Tracking Spreadsheet
| Cycle | Ticker | Start Date | End Date | Duration | CSP Premium | CC Premium | Cap Gain | Total Profit | ROI | Ann. ROI |
|---|---|---|---|---|---|---|---|---|---|---|
| 1 | AAPL | 2025-10-15 | 2025-12-20 | 66 days | $280 | $230 | $250 | $760 | 4.2% | 23.3% |
| 2 | MSFT | 2025-11-01 | 2026-01-15 | 75 days | $420 | $380 | $400 | $1,200 | 3.0% | 14.6% |
| 3 | NVDA | 2025-11-20 | 2026-01-05 | 46 days | $680 | $590 | $600 | $1,870 | 7.4% | 58.7% |
| 4 | SPY | 2025-12-01 | Open | 60 days | $310 | $180 | — | $490* | 2.7%* | 16.4%* |
*Cycle 4 is incomplete (still holding shares), so ROI is preliminary
This shows you:
- NVDA wheel cycles are most profitable (58.7% annualized) but high volatility
- MSFT cycles are slower (75 days avg) and lower ROI
- AAPL is the sweet spot: moderate duration, solid returns
- SPY cycle is incomplete—may need to roll or exit
How to Select Stocks for the Wheel (Stock Screening)
Not every stock works for the wheel. You need specific characteristics.
The 7 Criteria for Wheel-Friendly Stocks
| Criteria | Why It Matters | How to Check |
|---|---|---|
| 1. High liquidity | Tight bid-ask spreads = better fills | Average volume > 1M shares/day |
| 2. Moderate IV | Decent premiums without extreme volatility | IV Rank 30-70% |
| 3. Strong fundamentals | You'll hold shares if assigned | Positive earnings, reasonable P/E |
| 4. Low earnings volatility | Predictable moves, less gap risk | Earnings reactions < 10% avg |
| 5. Upward trend or range | Increases CC assignment probability | 52-week chart trending up or sideways |
| 6. Dividend (optional) | Extra income while holding shares | Yield 1-3% ideal |
| 7. You'd own long-term | Critical for downside protection | Would you hold through a 20% drop? |
Best Stock Categories for the Wheel
Tier 1: Blue-Chip Tech (Best for most traders)
- AAPL, MSFT, GOOGL, AMZN
- High liquidity, solid premiums, manageable volatility
- Risk: Tech sector concentration
Tier 2: Index ETFs (Most consistent)
- SPY, QQQ, IWM, DIA
- Lower volatility, lower premiums, but very reliable
- Risk: Lower absolute returns
Tier 3: Dividend Aristocrats (Best for conservative)
- JNJ, PG, KO, PEP
- Lower volatility, stable, dividend income during hold
- Risk: Lower premiums, slower cycles
Tier 4: High-Volatility Growth (Aggressive)
- NVDA, TSLA, AMD, COIN
- Massive premiums, fast cycles, high potential returns
- Risk: Large drawdowns if assigned at peak
Start with Tier 1 or 2 for your first 5 wheel cycles. Master the process before moving to high-volatility stocks.
The Step-by-Step Wheel Implementation
Let's walk through a complete wheel cycle with actual numbers.
Phase 1: Sell Cash-Secured Put
Step 1: Choose Your Stock
- Stock: AAPL (current price: $185)
- You're bullish on AAPL long-term and would happily own shares
Step 2: Select Strike & DTE
- Target: 0.30 delta put (70% probability of expiring worthless)
- DTE: 30-45 days (optimal theta decay range)
- Strike: $180 (2.7% below current price)
- Premium: $2.80 per share ($280 per contract)
Step 3: Reserve Capital
- Capital required: $180 × 100 = $18,000
Step 4: Sell the Put
- Execute order: Sell to Open 1 AAPL $180 Put @ $2.80
- Confirmation: +$280 premium collected
Step 5: Wait
- Monitor position weekly
- If stock stays above $180, you keep premium and repeat
- If stock drops below $180, prepare for assignment
Step 6: Assignment (If Triggered)
- Expiration day: Stock closes at $178
- You're assigned: Buy 100 AAPL shares at $180
- Effective cost: $180 - $2.80 = $177.20 per share
- Move to Phase 2
Phase 2: Sell Covered Call
Step 1: Assess Your Position
- You own 100 AAPL shares (cost basis: $177.20)
- Current price: $179
- Unrealized P&L: +$180 (small gain)
Step 2: Select Strike & DTE
- Target: 0.30-0.35 delta call
- DTE: 21-35 days
- Strike: $185 (3.4% above current price, above your cost basis)
- Premium: $2.50 per share ($250 per contract)
Step 3: Sell the Call
- Execute order: Sell to Open 1 AAPL $185 Call @ $2.50
- Confirmation: +$250 premium collected
Step 4: Wait
- If stock stays below $185, call expires worthless → Sell another call (repeat Phase 2)
- If stock rises above $185, prepare for assignment (complete the cycle)
Step 5: Assignment (If Triggered)
- Expiration day: Stock closes at $188
- You're assigned: Sell 100 shares at $185
- Capital gain: ($185 - $180) × 100 = $500
- Total profit this cycle: CSP ($280) + CC ($250) + Gain ($500) = $1,030
Step 6: Calculate Performance
- Capital deployed: $18,000
- Total profit: $1,030
- Cycle duration: 60 days (30 days CSP + 30 days CC)
- Cycle ROI: 5.7% | Annualized: 34.8%
What If the Stock Drops?
Scenario: Stock at $170 when your CC expires
You're still holding shares (bought at $180, now at $170).
Option 1: Sell another CC below cost basis
- Sell $175 CC (below your $177.20 cost basis)
- Collect $1.80 premium
- If assigned, you lock in a loss: ($175 - $180) × 100 = -$500
- But premiums collected ($280 CSP + $180 CC) partially offset: Net loss = -$40
Option 2: Sell CC above cost basis, wait for recovery
- Sell $180 CC for $0.90 premium
- Lower premium, but if assigned you break even or profit
- Risk: Stock stays below $180, you keep collecting small premiums while waiting
Option 3: Exit the position
- Sell shares at market ($170)
- Lock in loss: ($170 - $180) × 100 = -$1,000
- Premium collected: $280
- Net loss: -$720
- Free up capital to redeploy elsewhere
Which option?
- If you're still bullish on AAPL: Option 1 or 2
- If thesis has changed: Option 3
This is why you only wheel stocks you'd hold long-term.
Advanced Wheel Optimization Strategies
Once you've run 5-10 complete cycles, optimize with these tactics.
1. Multi-Cycle Tracking (Portfolio-Level Wheel Analytics)
Don't just track individual cycles. Track aggregate performance:
WHEEL PORTFOLIO PERFORMANCE (YTD)
Total Cycles Started: 12
Cycles Completed: 8
Cycles In Progress: 4
Avg Cycle Duration: 58 days
Avg Profit per Cycle: $847
Annualized ROI (all cycles): 28.4%

WIN RATE BY PHASE
CSP → Expired: 33% (4 out of 12)
CSP → Assigned: 67% (8 out of 12)
CC → Expired: 25% (2 out of 8)
CC → Assigned: 75% (6 out of 8)

BEST/WORST PERFORMERS
Best: NVDA (62% annualized across 2 cycles)
Worst: TSLA (-8% annualized, 1 incomplete cycle)
This tells you:
- Your CSP strikes are aggressive (67% assignment rate)
- Your CC strikes are working well (75% assigned = completing cycles)
- NVDA is your best wheel candidate
- TSLA should be avoided or exited
Use our Options Portfolio Management guide to track multi-cycle performance.
2. DTE Optimization by Phase
Different DTEs work better for different phases:
CSP Phase:
- 30-45 DTE: Best balance of premium and win rate
- <21 DTE: Higher premiums but higher gamma risk
- >45 DTE: Lower premiums but higher win rate
CC Phase:
- 21-35 DTE: Optimal for completing cycles
- 14-21 DTE: If you want shares called away quickly
- 35-45 DTE: If you're in no rush to exit shares
Recommendation: Use longer DTE (35-45) for CSPs to maximize win rate, shorter DTE (21-30) for CCs to complete cycles faster.
3. Rolling Strategies
If your position is challenged, rolling can save the cycle.
CSP Rolling (Stock dropped significantly):
- Original: Sold $180 CSP, stock at $165
- Roll: Buy back $180 CSP (at a loss), sell $175 CSP (next month)
- Collect additional premium, reduce strike, give stock more time to recover
CC Rolling (Stock rallied hard):
- Original: Sold $185 CC, stock at $195
- Roll: Buy back $185 CC (at a loss), sell $200 CC (next month)
- Keep shares, collect additional premium, participate in further upside
Rolling is advanced—only do this if you understand the mechanics. Read our guide: Rolling Cash-Secured Puts: When and How to Adjust
4. Earnings Management
Earnings create volatility spikes—both risk and opportunity.
Strategy A: Avoid Earnings
- Don't sell options expiring within 7 days of earnings
- Close positions before earnings, reopen after
Strategy B: Exploit IV Crush
- Sell CSP/CC after earnings (premiums still elevated, but event risk is gone)
- Capture residual IV without holding through earnings
Strategy C: Sell into Earnings (Advanced)
- Sell CSP with 35+ DTE expiring after earnings
- Collect elevated premiums
- Risk: Large gap moves against you
For beginners: Use Strategy A. Avoid earnings until you have 10+ completed cycles.
5. Assignment Timing Optimization
You can influence when you get assigned by adjusting deltas.
Want to get assigned (Phase 1)?
- Sell 0.40-0.45 delta CSPs
- Strike closer to current price (2-3% OTM vs 5-7%)
- Shorter DTE (21-30 days)
Don't want to get assigned (Phase 1)?
- Sell 0.20-0.25 delta CSPs
- Strike farther from current price (8-12% OTM)
- Longer DTE (45-60 days)
Want shares called away (Phase 2)?
- Sell 0.40-0.45 delta CCs
- Strike closer to current price (3-5% OTM)
- Shorter DTE (14-21 days)
Want to keep shares (Phase 2)?
- Sell 0.20-0.25 delta CCs
- Strike farther from current price (8-12% OTM)
- Longer DTE (35-45 days)
Control your assignment rate to match your goals.
Common Wheel Strategy Mistakes (And Fixes)
Mistake 1: Running Wheels on Meme Stocks
Bad: "AMC has crazy premiums! I'll wheel it."
Reality: Stock drops 40% after assignment, you're stuck holding shares you don't believe in.
Fix: Only wheel stocks with strong fundamentals that you'd hold through a 20% drawdown.
Mistake 2: Selling CCs Below Cost Basis
Bad: "I got assigned at $180, stock is at $170. I'll sell a $175 call to collect premium."
Reality: If assigned, you lock in a $500 loss to collect $150 in premium. Net loss: $350.
Fix: Only sell CCs above cost basis unless you're intentionally exiting at a loss. Better to wait for recovery or exit entirely.
Mistake 3: Not Tracking Complete Cycles
Bad: "I made $280 on this CSP, then $230 on this CC. That's $510 profit!"
Reality: Those are two separate trades on different stocks. You didn't complete a wheel cycle—you just sold two unrelated options.
Fix: Track CSP → CC as a single cycle. Calculate ROI based on the full holding period and capital deployed.
Mistake 4: Ignoring Sector Concentration
Bad: "I'm running 5 wheels on AAPL, MSFT, NVDA, GOOGL, AMZN."
Reality: All tech stocks. If tech crashes, all 5 positions get assigned and drop simultaneously.
Fix: Diversify wheels across sectors (tech, healthcare, finance, consumer goods).
Mistake 5: Treating Wheels as Passive
Bad: "I just set it and forget it. The wheel is autopilot income."
Reality: You need weekly monitoring, monthly performance reviews, and active management during assignments.
Fix: Set calendar reminders for weekly checks and monthly cycle reviews. Use our Options Trading Journal to track every cycle.
Hidden Costs: Opportunity Cost and Holding Period Traps
Two invisible drags erode wheel returns over time. First is opportunity cost: a typical wheel ties up $5,000–$20,000 in cash or stock per position. While you are earning 1–2% monthly premium, that same capital deployed in an index fund or growth position might compound at a higher long-term rate. The premium feels like income, but the capital is effectively frozen.
Second is the holding-period trap. When you get assigned shares, you cannot immediately sell covered calls at your cost basis without risking wash-sale complications or unfavorable short-term tax treatment. Many traders find themselves locked into the position for 30 to 90 days, unable to optimize the call strike or exit efficiently. This lock-in turns a flexible options strategy into a rigid stock position at exactly the moment when agility matters most.
Taxes and Capital Efficiency
Beyond opportunity cost, the wheel has two structural inefficiencies that most backtests ignore.
Tax drag. Every premium you collect is taxed as short-term capital gains. Unlike buy-and-hold investors who defer taxes indefinitely, wheel traders generate taxable events every 30–45 days. A 20% gross return can quickly become 12–14% after taxes in a high bracket.
Capital inefficiency. A cash-secured put ties up 100% of the notional value. Sell a put on a $150 stock and you need $15,000 sitting idle in your account. That cash earns nothing while it waits. Compared to buy-and-hold, where every dollar is working, the wheel is expensive to run.
The 90-day trap. When you get assigned, you usually sell covered calls slightly out-of-the-money to collect decent premium. If the stock goes sideways, you roll month after month. It is common to hold a position for 90+ days before it gets called away, with your capital locked in a stock that is going nowhere.
These are not mistakes. They are structural features of the strategy.
DaysToExpiry Wheel Analytics: Automated Tracking
If you use Interactive Brokers, we've built automatic wheel cycle detection into DaysToExpiry Portfolio Analyzer.
Upload your IB statement and instantly see:
Wheel Cycle Dashboard:
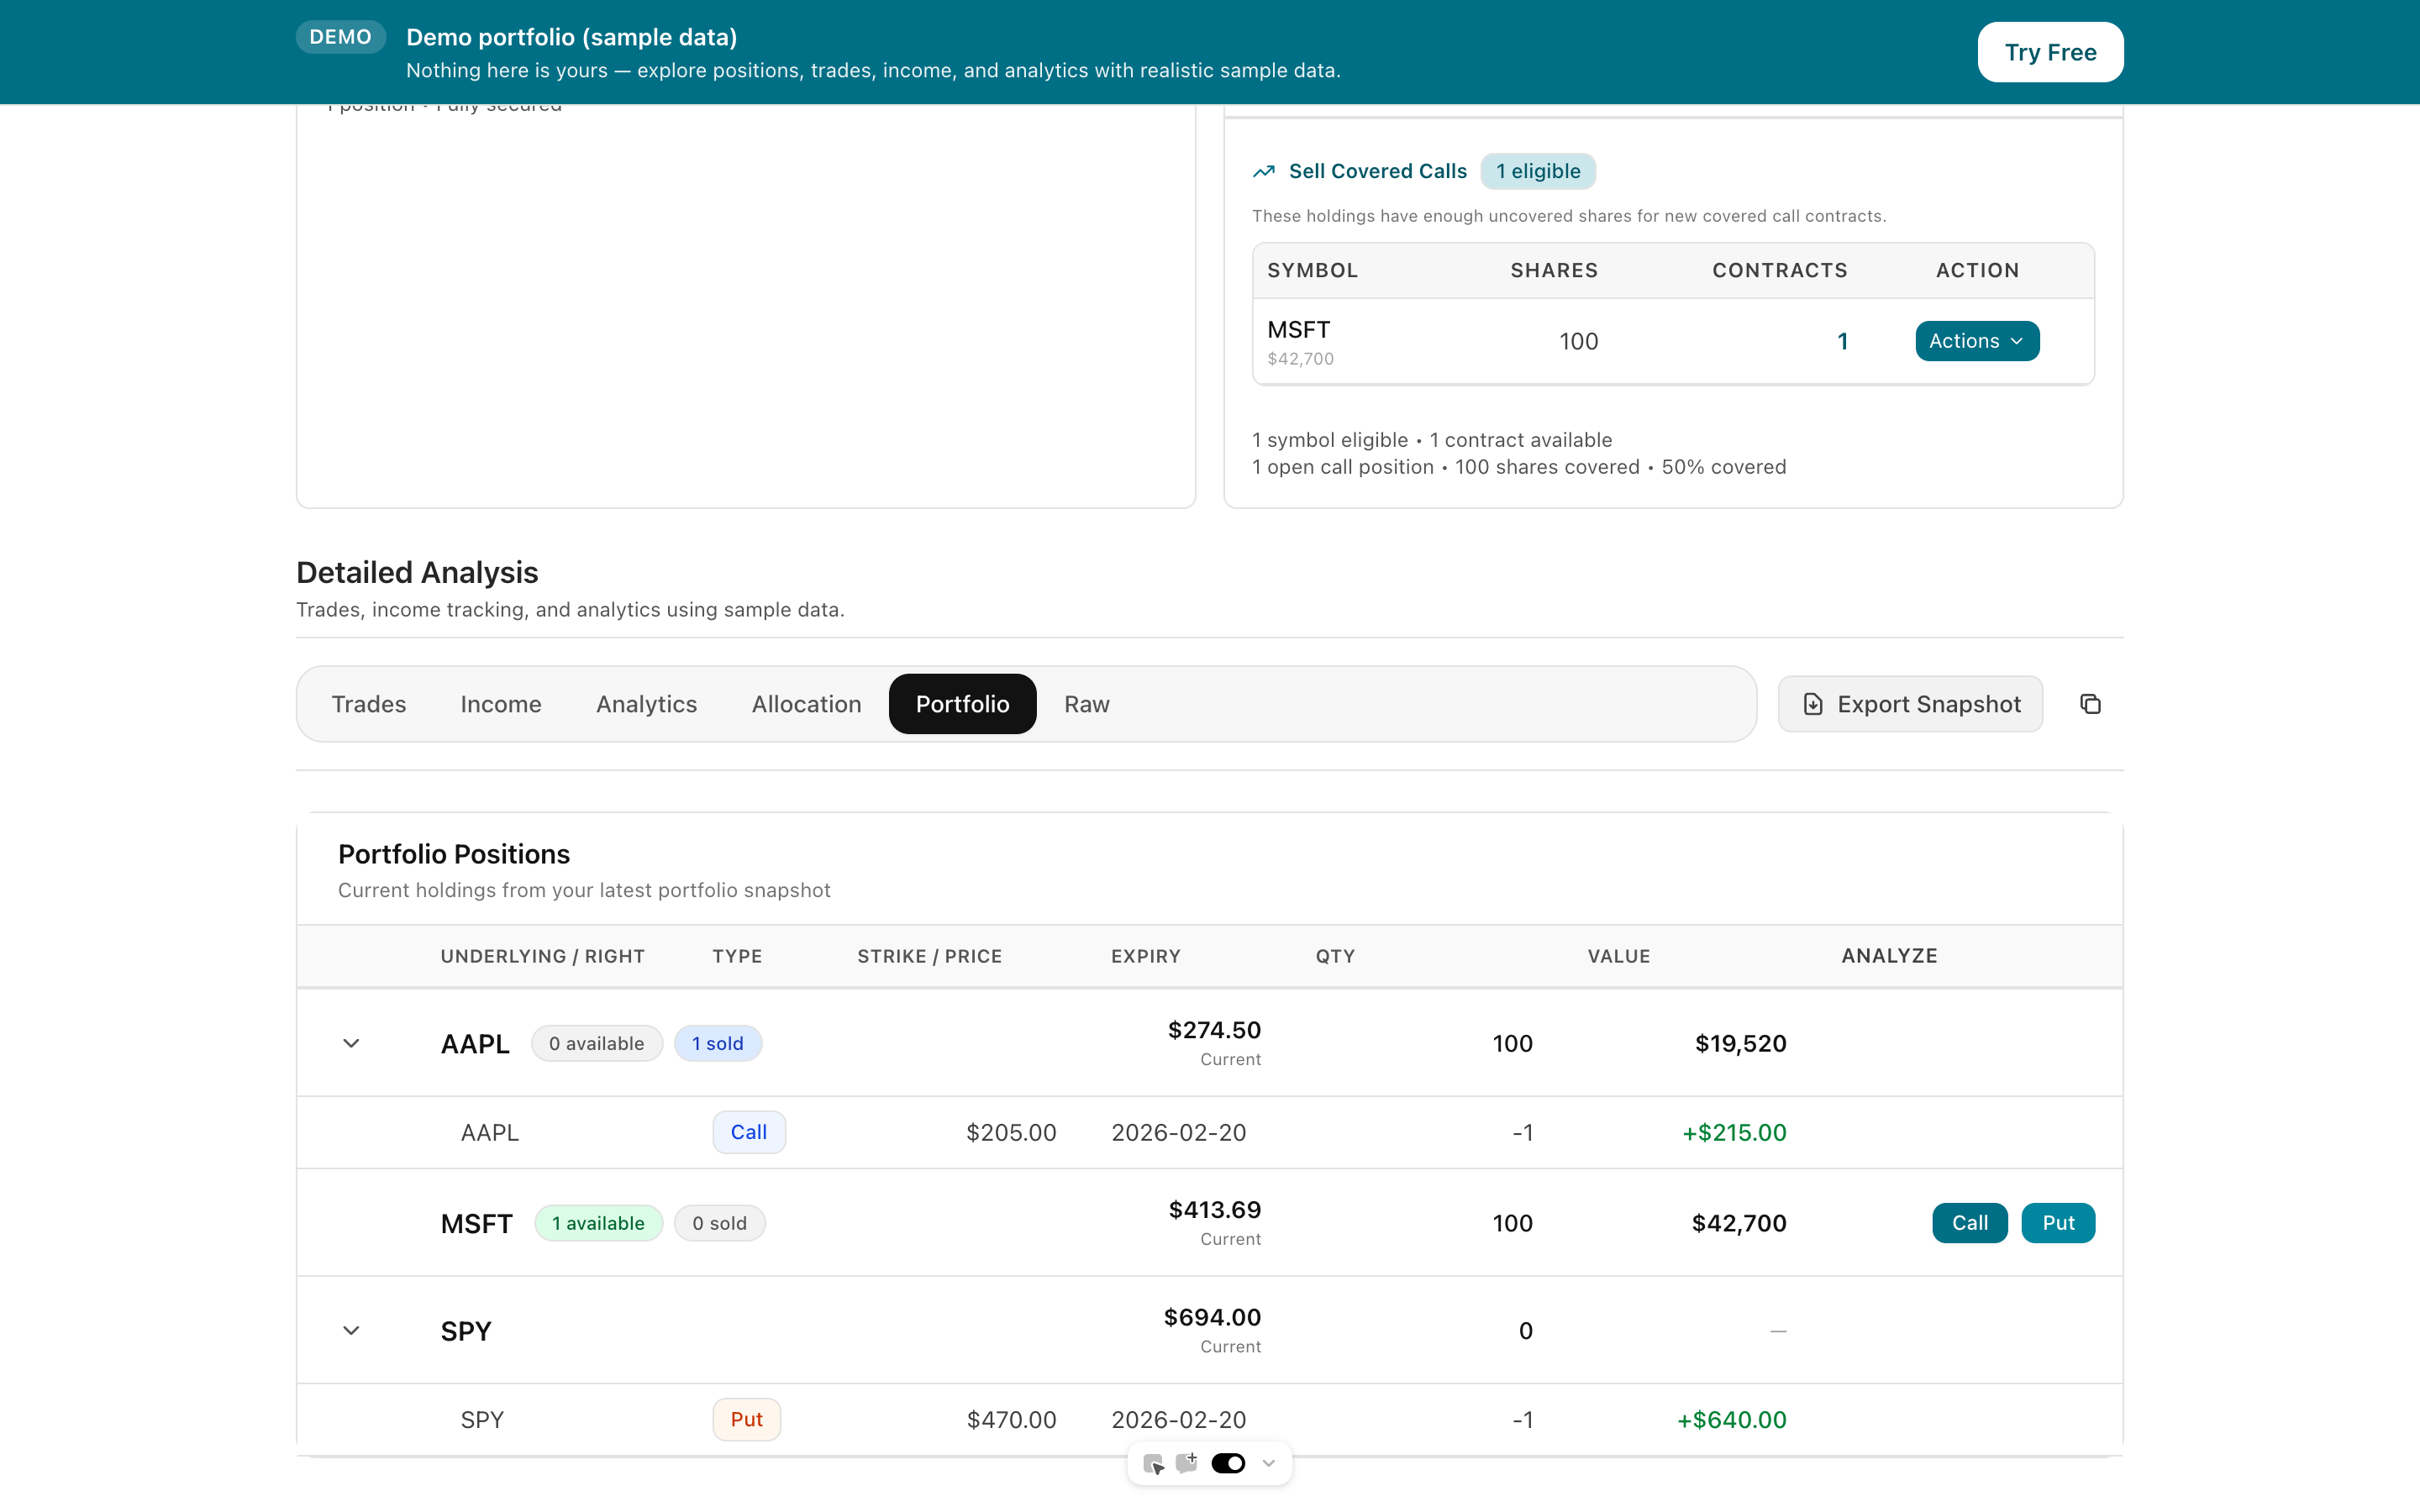 Dive deep into all wheel trades of your IBKR portfolio with strategy-specific analysis
View in app →
Dive deep into all wheel trades of your IBKR portfolio with strategy-specific analysis
View in app →
- Cycle detection: Automatically links CSP → CC trades by ticker
- Cycle duration: Shows how long each cycle took
- Profit per cycle: Calculates total profit (CSP + CC + capital gain)
- Annualized ROI: Adjusts for holding period
- Win rate by phase: Shows CSP expiration rate vs CC assignment rate
- Best/worst tickers: Ranks stocks by wheel performance
No manual tracking. No spreadsheets. Just upload and analyze.
Automate your wheel tracking: Use DaysToExpiry Portfolio Analyzer to automatically detect and track complete wheel cycles from your Interactive Brokers activity statements.
Your Wheel Strategy Checklist (Implementation)
Here's your step-by-step implementation plan:
Pre-Wheel Setup (Week 1)
- Choose 3-5 stocks you'd own long-term
- Verify liquidity (volume > 1M shares/day)
- Check IV Rank (30-70% ideal)
- Set aside capital reserves (keep 20% cash for multiple cycles)
- Create tracking spreadsheet (or set up DaysToExpiry account)
First Wheel Cycle (Weeks 2-4)
- Sell first CSP (0.30 delta, 30-45 DTE)
- Document entry: date, strike, premium, DTE
- Set calendar reminder for expiration week
- If assigned: immediately sell CC (0.30-0.35 delta, 21-35 DTE)
- If not assigned: start next CSP
First 5 Cycles (Months 2-4)
- Run 5 complete cycles (mix of stocks)
- Track every cycle: duration, profit, ROI
- Calculate average cycle duration and ROI
- Identify best-performing stock
- Adjust DTE/delta based on results
Portfolio Scaling (Month 5+)
- Run 3-5 simultaneous wheel cycles
- Diversify across sectors
- Implement portfolio-level tracking
- Monthly performance reviews
- Optimize based on data
The Bottom Line
The wheel strategy isn't autopilot income. It's a systematic, multi-phase process that requires tracking and optimization.
Most traders fail at the wheel because they:
- Don't track complete cycles (only individual trades)
- Run wheels on stocks they don't understand
- Panic when assigned and make emotional decisions
- Lack portfolio-level analytics
Build a system:
- Screen stocks rigorously (fundamentals + liquidity)
- Set consistent DTE and delta targets
- Track complete cycles as single units
- Review performance monthly
- Adjust based on data, not emotion
Over 10+ cycles, you'll know:
- Which stocks work best for your strategy
- What DTE ranges optimize your ROI
- Whether the wheel fits your risk tolerance
Start with 1-2 cycles. Track everything. Scale with confidence.
And remember: The wheel is a system, not a single trade. Master the system.
Track your wheel cycles automatically: Upload your IBKR statement to DaysToExpiry Portfolio Analyzer for automatic cycle detection, profit tracking, and performance analytics. Or use our Options Trading Journal to manually track cycles across any broker.
For deep-dives on each phase, read Cash-Secured Puts Strategy Explained: A DTE-Focused Playbook and Selling Covered Calls for Income: Step-by-Step Strategy. To learn how to structure multiple wheels across your portfolio, check out Options Portfolio Management: Complete Guide to Wheel Strategy Analytics.
product: "portfolio-view"
Related Articles
Expertise: The Days to Expiry Trading Team brings 10+ years of hands-on experience managing options strategies across diverse market conditions. Our specialists have built and refined portfolio analytics tools used by thousands of traders to track CSP-to-CC cycles, assignment rates, and true ROI. Learn more about our methodology and credentials on our team page.
Download our free Wheel Strategy Tracker spreadsheet to monitor your CSP-to-CC cycles, assignment rates, and true ROI across your portfolio.
Frequently Asked Questions
Written by Days to Expiry Trading Team
The Days to Expiry trading team brings together experienced options traders and financial analysts dedicated to helping investors generate consistent income through proven options strategies.
Apply The Strategy