There's a chart taped to the wall of every serious options trader's desk.
It shows a curve that starts flat, then bends sharply upward at the end. On the bottom axis: "Days to Expiration." On the side: "Theta Decay."
This chart is the reason income traders wake up happy.
Because theta decay is the only force in the market that helps you automatically every single day. The stock could stay flat. Volatility could stay the same. But every night the market closes, theta eats away a tiny piece of your short option's value.
Over 45 days, that "tiny piece" compounds into real money.
But here's what most traders get wrong: theta doesn't decay at a constant rate. It accelerates. Dramatically. And understanding that acceleration—and timing your trades around it—is the difference between decent income and exceptional income.
Cash-Secured Put Income Optimizer
Compare income from selling puts at different expiration timeframes
Enter a stock symbol to see income projections with live prices
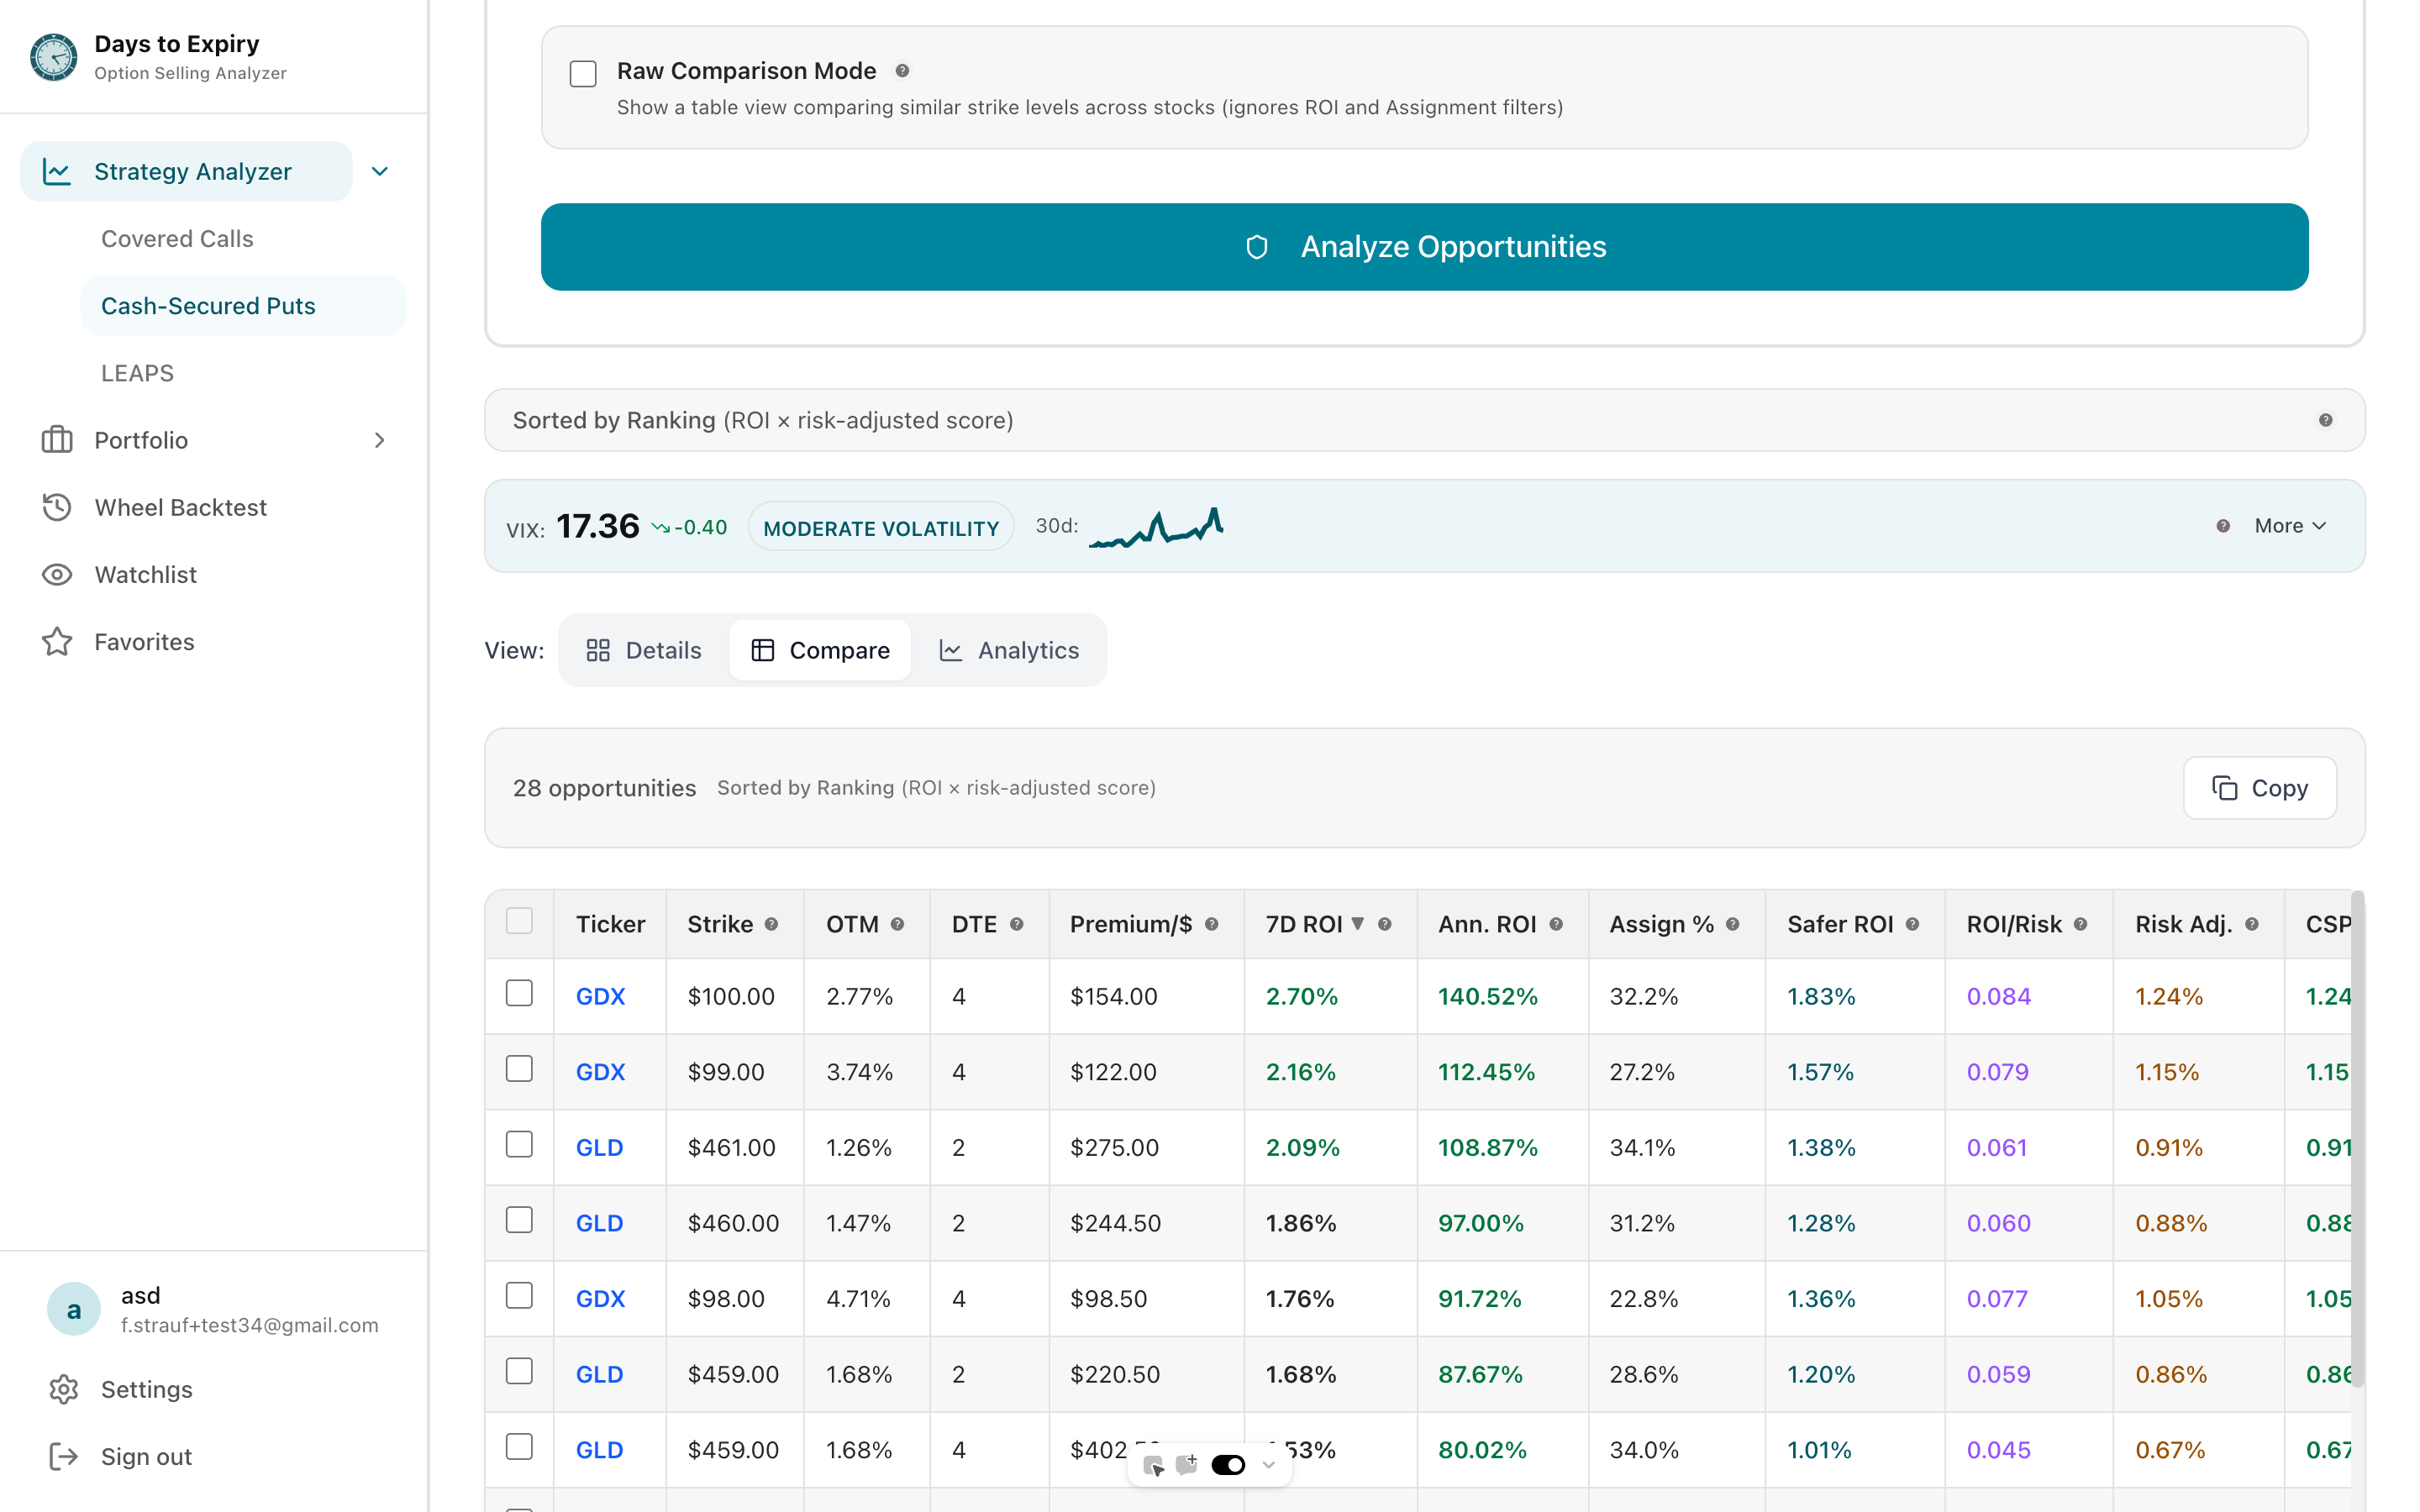
See theta in action: Our Strategy Analyzer shows how premium and ROI change across different DTE ranges, helping you identify the optimal entry point for maximum theta capture.
What Is Theta Decay? The Math Behind Time Value Erosion
Theta decay represents the rate at which an option's [extrinsic value](TODO: link) erodes as time passes. For options sellers, theta is the primary source of income. For buyers, it's the silent cost that works against them every single day.
An option's premium consists of two components:
- Intrinsic value – The amount by which an option is in-the-money (ITM). For out-of-the-money (OTM) options, this is always $0.
- Extrinsic value (time value) – The portion of premium attributable to time remaining before expiration. This is where theta operates.
Theta is always negative for long options and positive for short options. When you sell an option, you collect premium upfront, and theta works in your favor as that premium decays toward zero at expiration.
Why Theta Decay Accelerates Near Expiration
The mathematical explanation lies in the square root of time. An option's time value doesn't decrease linearly—it decreases proportionally to the square root of the remaining time. This creates the characteristic "convex" decay curve that defines successful [options income strategies](TODO: link).
The square root rule simplified:
- A 90-day option has √90 ≈ 9.5 units of time value
- A 30-day option has √30 ≈ 5.5 units of time value
- A 7-day option has √7 ≈ 2.6 units of time value
- A 1-day option has √1 = 1 unit of time value
Notice how the time value doesn't scale linearly with days? That's why theta accelerates as expiration approaches.
The Theta Decay Curve: Why It Bends
Let's start with the visual.
A 30-day put option at various DTEs:
Option Premium ($)
4.00 |●
3.50 | ●
3.00 |  ●
2.50 |   ●
2.00 |    ●
1.50 |      ●
1.00 |         ●
0.50 |              ●
0.00 |_____________________________
     30  24  18  12  6   3   1  0
     Days to Expiration (DTE)
See that curve? It stays relatively flat for the first 20 days, then bends sharply upward.
Why?
A 30-day option has 30 days of time value built in. So it decays roughly 1/30th of that value per day—about $0.10/day (assuming the stock stays in the same place).
But a 3-day option? It has only 3 days of time value left. On day 3, it decays 1/3rd of its remaining value in a single day. On day 1, it might decay 90% of whatever's left.
The acceleration formula:
- Day 30: Theta per day ≈ Premium / 30
- Day 15: Theta per day ≈ Premium / 15 (double the rate)
- Day 7: Theta per day ≈ Premium / 7 (triple the rate)
- Day 1: Theta per day ≈ Premium / 1 (up to 10x the rate of day 30)
This is convex decay. The closer to expiration, the faster it accelerates.
Visualizing the Acceleration Zones
Understanding where you are on the theta curve determines your trading decisions:
| Zone | DTE Range | Decay Characteristic | Daily Theta Rate |
|---|---|---|---|
| Flat Zone | 45-60+ days | Slow, predictable decay | 1-2% of premium |
| Sweet Spot | 30-45 days | Moderate acceleration begins | 2-4% of premium |
| Acceleration Zone | 14-30 days | Noticeable daily P&L improvement | 4-10% of premium |
| High Octane | 7-14 days | Rapid decay, elevated risk | 10-25% of premium |
| Binary Zone | 0-7 days | Extreme decay, gamma dominance | 25-50%+ of premium |
Real-World Theta Examples: Cash-Secured Puts
Let's put numbers on this.
Example: XYZ stock at $100. You sell a $95 put.
| DTE | Premium | Theta/Day | % Decay/Day | Cumulative Profit |
|---|---|---|---|---|
| 45 days | $2.50 | $0.08 | 3.2% | — |
| 30 days | $1.80 | $0.12 | 6.7% | $0.70 |
| 21 days | $1.35 | $0.15 | 11.1% | $1.15 |
| 14 days | $0.85 | $0.20 | 23.5% | $1.65 |
| 7 days | $0.42 | $0.30 | 71% | $2.08 |
| 3 days | $0.12 | $0.10 | 83% | $2.38 |
| 1 day | $0.02 | $0.02 | 90%+ | $2.48 |
What this shows:
- For the first 30 days, you collect roughly $0.08-0.12 per day
- In days 14-7, theta accelerates—you're collecting $0.20-0.30 per day
- In the final 3 days, you collect $0.30 per day but the option is worth nothing anyway
The income trader's realization: More than 40% of your profit comes in the final 14 days. More than 70% comes in the final 3 weeks.
This is why rolling strategies work so well. If you close at 21 DTE (capture 80% of profit, avoid the binary week), and sell the next cycle, you've repeated the profitable 30-45 DTE range.
Theta Decay by Strategy Type
Different strategies experience theta decay differently based on their structure:
Naked Puts/Calls: Experience the full convexity of the theta curve. Maximum decay acceleration in final weeks but maximum gamma risk too.
Vertical Spreads: Net theta is reduced because your long option also decays. The curve is flatter but so is the risk profile.
Iron Condors: Theta is your primary income source. The width of your spreads determines how much convexity you capture versus risk you take.
The Acceleration Zone (0-60 DTE)
Income traders focus on the sweet spot: 14-45 days to expiration.
Here's why:
| Period | Theta Rate | P&L Stability | Gamma Risk | Why You Like It |
|---|---|---|---|---|
| 45+ DTE | Slow ($0.08/day) | Super stable | Very low | Boring but safe. Use for larger positions. |
| 30-45 DTE | Moderate ($0.10-0.15/day) | Stable | Low | The Goldilocks zone. Sweet spot for entry. |
| 14-30 DTE | Accelerating ($0.15-0.25/day) | Stable | Moderate | Theta picks up. P&L swings become visible. |
| 7-14 DTE | High ($0.25-0.40/day) | Volatile | High | Fast decay but big stock moves hurt fast. |
| 0-7 DTE | Extreme ($0.40+/day) | Very volatile | Very high | Binary. Theta is your friend; gamma is your enemy. |
DTE-Based Position Management Framework
The income trader's strategy at each DTE:
-
At 45 DTE: Enter the trade.
- Theta is slow but manageable
- Stock moves matter more than time decay
- Collect the initial premium cushion
-
At 30 DTE: Monitor, don't panic.
- Theta is paying you $0.10+ per day
- If the position is profitable, you can hold
- Watch for any catalysts (earnings, Fed announcements)
-
At 21 DTE: Decide to roll or close.
- You've captured 60-70% of max profit
- Volatility spikes are more likely from here out
- This is the traditional "take profits" zone
-
At 14 DTE: Theta is accelerating.
- One big stock move can swing your P&L $100+ on a single put
- Plan your exit strategy now
- Consider rolling if the position is underwater
-
At 7 DTE: Theta is your friend, gamma is your enemy.
- Hold if profitable (theta wins)
- Close if losing (gamma risk explodes)
- Binary outcomes become more likely
-
At 3 DTE: Binary zone.
- Option is either expiring worthless or getting assigned
- Theta is irrelevant now
- Make your final decision: take assignment or buy to close
Theta vs Gamma: The Critical Tradeoff
Here's the hidden math that separates winners from losers:
Theta is what you earn from time decay. Gamma is the cost when the stock moves against you.
On a 30-day put:
- You earn $0.08 in theta per day
- But if the stock moves against you $2, your option gains $0.40 in value
- Net: You still profit, but the stock move hurt more than time helped
On a 3-day put:
- You earn $0.30 in theta per day
- If the stock moves against you $2, your option might gain $1.50 in value
- Net: You lose $1.50, and that happened in 24 hours
Understanding Gamma Risk
[Gamma](TODO: link) measures how much delta changes when the underlying moves. Near expiration, gamma spikes dramatically:
| DTE | Approximate Gamma Multiplier | Risk Level |
|---|---|---|
| 45 days | 1x (baseline) | Low |
| 30 days | 1.5x | Low-Moderate |
| 21 days | 2x | Moderate |
| 14 days | 3x | High |
| 7 days | 5x | Very High |
| 3 days | 10x+ | Extreme |
The practical reality: You want to sell options when theta is high AND gamma is low. That's the 30-45 DTE window.
In the final week, theta is amazing but gamma explodes. One bad earnings gap can destroy your position before theta has time to work.
Strategy Examples: Optimizing for Theta
Covered Calls: The Theta Machine
Setup: Own 100 shares of Apple at $150. Sell $155 call.
Theta by DTE:
- 45 DTE: Collect $0.04/day (premium decay is slow)
- 30 DTE: Collect $0.08/day (accelerating)
- 14 DTE: Collect $0.15/day (your money printer is humming)
- 7 DTE: Collect $0.25/day (half your weekly income comes this week)
- 3 DTE: Collect $0.30/day (but stock moves are deadly)
Decision: At 45 DTE on Monday, you sell the call. By 21 DTE on Monday of week 3, you've collected ~$1.20 of your $1.50 premium (80%). You roll into the next week's $157 call for $0.80 credit.
Net result: You've made $1.20 + $0.80 = $2.00 on two calls, capturing the theta curve twice. Much better than holding the first call to expiration and watching gamma destroy you.
Cash-Secured Puts: Playing the Acceleration
Setup: $10,000 cash reserved. Sell $95 put on XYZ (costs max $9,500 if assigned).
| Week | DTE | Theta Collected | Cumulative |
|---|---|---|---|
| 1 | 42-49 | $0.50 | $0.50 |
| 2 | 35-42 | $0.80 | $1.30 |
| 3 | 28-35 | $1.00 | $2.30 |
| 4 | 21-28 | $1.20 | $3.50 |
| 5 | 14-21 | $1.50 | $5.00 |
| 6 | 7-14 | $1.80 | $6.80 |
Notice: Weeks 4-6 produce 60% of your total theta. Week 6 alone produces almost as much as weeks 1-2 combined.
Smart trader move: If you collect 75% of max profit by 21 DTE, close it. Don't wait for the last week. You're exposing yourself to binary risk (big stock move or earnings) that could wipe out weeks of gains.
Put Credit Spreads: Theta Without the Tail Risk
Setup: Sell $50 put / Buy $45 put (width = $5, max profit = $500)
Short put (seller's perspective):
- Theta: $0.08/day at 45 DTE → $0.30/day at 7 DTE
- Gamma: Low-to-moderate (spread is wide)
Long put (insurance):
- Theta: -$0.04/day (you pay theta on the long strike)
- Gamma: Protects you if it gaps down
Net theta: ~$0.04/day at 45 DTE, accelerating to ~$0.25/day at 7 DTE.
You collect most of that $500 from theta, but the long put caps your loss at $500 max. Compare to naked puts where gamma can wipe you out.
Calendar Spreads: Exploiting Theta Differentials
Calendar spreads (also called time spreads) are unique because they involve options with different expirations. You sell a near-term option and buy a longer-term option at the same strike.
How theta works in calendars:
- Short leg (30 DTE): Decays at $0.15/day
- Long leg (60 DTE): Decays at $0.06/day
- Net theta capture: $0.09/day
The strategy profits when the near-term option decays faster than the long-term option—a direct bet on theta convexity.
The Hidden Cost: When Theta Isn't Your Friend
Here's the trap every new options seller falls into:
You sell a call at 60 DTE thinking: "I'll let it ride to expiration and collect maximum theta."
What actually happens:
- Days 60-20: Theta is working for you. Good.
- Days 20-14: Earnings are released. IV spikes 40%.
- Day 14: Your $0.50 option is now worth $1.20 because IV is higher.
- Day 14: You decide to "wait for theta to eat the rest."
- Days 14-7: Theta decay is happening, but IV is still elevated. The option only drops to $1.10.
- Day 7: Theta accelerates, option drops to $0.50.
- Days 7-3: Stock has a strong move. Your $0.50 option is now $2.00 in value.
- Day 1: Gamma destroys your position.
What went wrong? You ignored gamma risk in pursuit of maximum theta.
The fix: Exit at 21 DTE with 75% of profit, or at 14 DTE if IV spikes. Theta is not linear—it's affected by other Greeks.
The Impact of Implied Volatility on Theta
Implied volatility (IV) significantly affects how theta behaves:
High IV Environments:
- Options carry more extrinsic value
- Theta decay appears larger in dollar terms
- However, IV crush can accelerate decay beyond normal theta
Low IV Environments:
- Less extrinsic value to decay
- Theta is smaller in absolute terms
- Decay is more predictable but less profitable
This is why many income traders prefer selling options after volatility spikes—there's more theta to capture.
Practical Theta Calendar: Your Trading Playbook
Use this to plan your entries and exits:
| Days to Expiry | Action | Reason |
|---|---|---|
| 45+ DTE | ENTER | Theta is slow but survivable. IV premiums are fresh. |
| 30-45 DTE | HOLD | Theta is accelerating. P&L is positive if trade is working. |
| 21-30 DTE | DECIDE | You've captured 60-70% of max profit. Decide: roll or close. |
| 14-21 DTE | CLOSE or ROLL | Theta accelerates but gamma becomes a bigger risk factor. |
| 7-14 DTE | CLOSE unless profitable | Theta is great but one stock move can destroy the trade. |
| 0-7 DTE | MANAGEMENT MODE | Theta is irrelevant. Gamma is everything. Close or manage. |
Theta Management Checklist
Before entering any short options position, verify:
- Is my entry DTE between 30-45 days?
- Have I identified my profit-taking DTE (21 or 14)?
- Am I aware of any upcoming earnings or catalysts?
- Do I have a rolling plan if the trade moves against me?
- Is my position size appropriate for the gamma risk at my target DTE?
Real Portfolio: Tracking Theta Decay
Here's how a professional income trader tracks theta across positions:
| Symbol | Strike | Premium | Entry Date | Current DTE | Theta/Day | Days Held | Profit Realized | P&L Now | Decision |
|---|---|---|---|---|---|---|---|---|---|
| QQQ | 380C | $0.85 | Oct 23 | 14 | $0.22 | 15 | $0.50 | -$0.12 | Close (not working) |
| SPY | 440P | $1.20 | Oct 26 | 11 | $0.28 | 12 | $0.80 | +$0.30 | Hold (theta winning) |
| AAPL | 155C | $0.60 | Oct 20 | 8 | $0.35 | 22 | $0.45 | +$0.12 | Close (roll next week) |
Key insight: Column "Theta/Day" shows which positions are in the acceleration zone (good) vs. which are in the binary zone (risky).
Tracking Your Portfolio Theta
Advanced traders track portfolio-level theta to understand their daily income expectation:
Portfolio Theta Example:
| Position | Contracts | Theta/Contract | Total Theta |
|---|---|---|---|
| AAPL Put | 2 | +$0.12 | +$24/day |
| SPY Call | 3 | +$0.08 | +$24/day |
| TSLA Put | 1 | +$0.25 | +$25/day |
| Total | +$73/day |
This portfolio generates approximately $73 per day from time decay alone—assuming all other factors remain constant.
Advanced Theta Concepts
Theta Skew Across Strikes
Not all strikes decay at the same rate. ATM options have the highest theta, while OTM and ITM options decay differently:
| Strike Relationship | Theta Characteristic |
|---|---|
| Deep ITM | Low theta, mostly intrinsic value |
| ATM | Highest theta, maximum time value |
| Slight OTM | High theta, accelerating near expiration |
| Far OTM | Low theta, "lottery ticket" behavior |
Understanding skew helps you select optimal strikes for theta capture.
Weekend Theta Decay
Options don't trade over weekends, but theta decay continues. This creates the "weekend effect":
- Friday close to Monday open: 3 days of theta decay priced in
- Typically results in lower option prices Monday morning
- Income traders often close positions Friday to capture weekend theta
Theta and Dividends
For dividend-paying stocks, theta behavior changes around ex-dividend dates:
- Call options: Theta may appear lower as dividend value is priced in
- Put options: Can show inflated theta due to early assignment risk
- Always check ex-div dates when planning theta-based strategies
Common Theta Mistakes (And How to Avoid Them)
Mistake #1: Holding Too Long
The error: Believing you must hold to expiration to capture maximum theta.
The reality: The final week's gamma risk usually outweighs the remaining theta. Close at 21 DTE with 75% profit.
Mistake #2: Ignoring Volatility
The error: Focusing only on theta while ignoring implied volatility.
The reality: An IV spike can add more value to a short option than a week of theta decay removes. Monitor VIX and earnings calendars.
Mistake #3: Wrong Position Sizing
The error: Sizing positions based on buying power, not gamma risk.
The reality: A position that's comfortable at 45 DTE can become terrifying at 7 DTE. Size for the gamma you'll face, not just the premium you're collecting.
Mistake #4: Trading Low-IV Environments
The error: Forcing trades when volatility is at historic lows.
The reality: When IV rank is below 20, there's simply not enough extrinsic value to make theta strategies worthwhile. Wait for better setups or trade directionally.
The Bottom Line
Theta decay is convex. It starts slow, then accelerates dramatically.
The sweet spot is 30-45 DTE. Enter here. Exit by 21 DTE to capture 60-80% of maximum profit.
Don't hold for expiration. Gamma risk in the final week typically exceeds the value of final theta decay.
Track your theta calendar. Know exactly which week each position moves from "theta acceleration" to "gamma explosion."
Respect the Greeks. Theta doesn't exist in isolation—it dances with gamma, vega, and delta. Successful income traders understand the interplay.
Income traders don't wait for 100% of the profit. They take 70% quickly, then repeat the cycle. Over a year, capturing 70% six times beats getting stuck holding a position that turns against you.
The theta decay curve is your friend—but only if you know when to get on and when to get off.
Related Articles
- Options Greeks Explained: Income Trader's Guide – Understand delta, gamma, vega alongside theta
- Cash-Secured Puts Playbook: DTE Optimization & Assignment Risk – Real examples of theta-driven decision making
- The Wheel Strategy: Complete DTE-Optimized Guide – Theta decay across multiple strategy phases
- Put Credit Spreads: Risk-Defined Income Strategy – How spreads manage theta vs gamma tradeoff
- Gamma Risk Near Expiration: What Every Options Seller Must Know
- The 21 DTE Rule Explained: When and Why to Close Options Positions Early
- SPY vs SPX Options: Complete Comparison with Decision Framework
- IV and DTE Timing: How Implied Volatility Affects Option Decay – How IV changes affect theta strategies