See historical assignment rates, win ratios, and average hold times for every trade—before you commit capital
Most options backtesting tools force you to define a strategy first, wait for results, and hope the parameters were right. By the time you get answers, the opportunity is gone. Days to Expiry flips the script. Every opportunity in our scanner comes with pre-computed historical performance data. See exactly how similar trades performed—instantly.
Tap to view full size
Complex Setup Required — Define strategies, parameters, and wait for batch processing
Strategy-Level Only — Aggregated results, not specific to the opportunity in front of you
Opportunity Window Closed — By the time backtest completes, the trade is gone
Premium Add-On Pricing — Competitors charge $99+/month for backtesting features
Historical performance appears instantly for every opportunity—no waiting, no setup.
Actual historical percentages, not theoretical probabilities, based on multi-year data.
Historical probability of profit for similar market conditions and strike selections.
Backtesting is included at no extra cost—no premium add-on required.
Tap to view full size
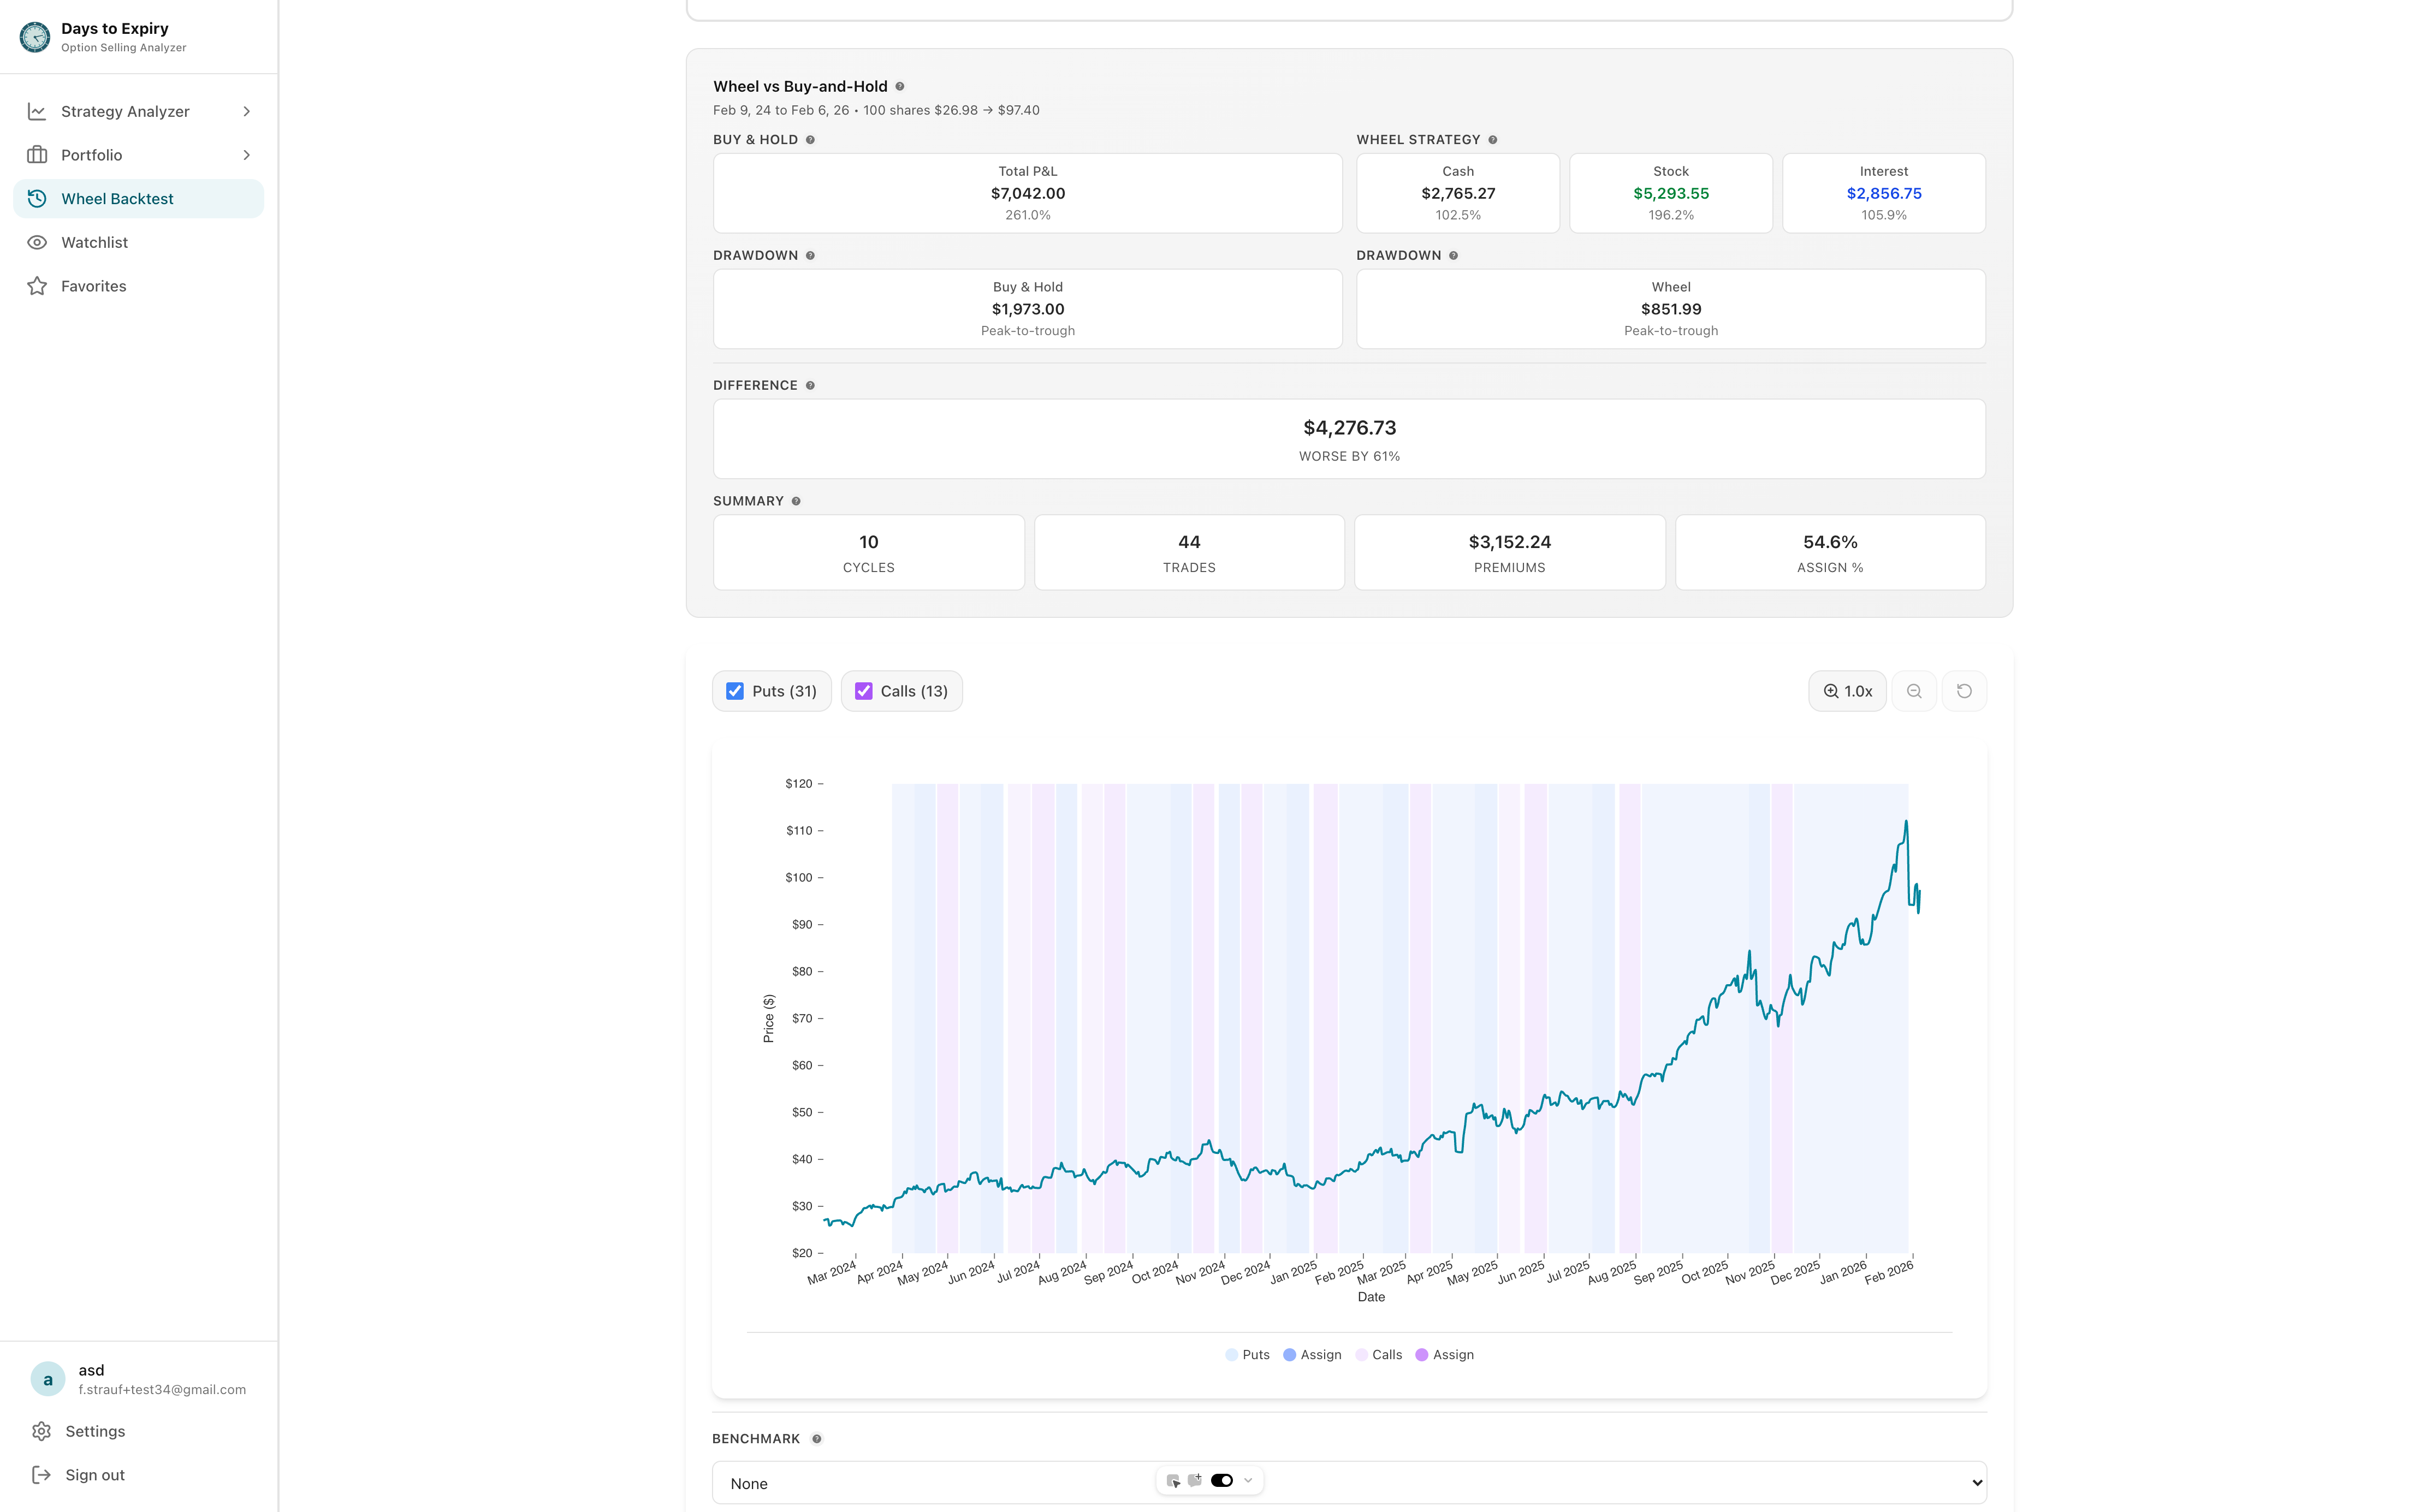
Run any scan in our covered call, CSP, or LEAPS screener. Every result includes a backtest panel.
See assignment rate, win ratio, and average hold time for trades matching the same strike, DTE, and underlying characteristics.
Enter positions knowing the historical odds—not just theoretical delta and IV estimates.
Years of Data
5+
Trades Backtested
2M+
Update Frequency
Daily
Extra Cost
$0
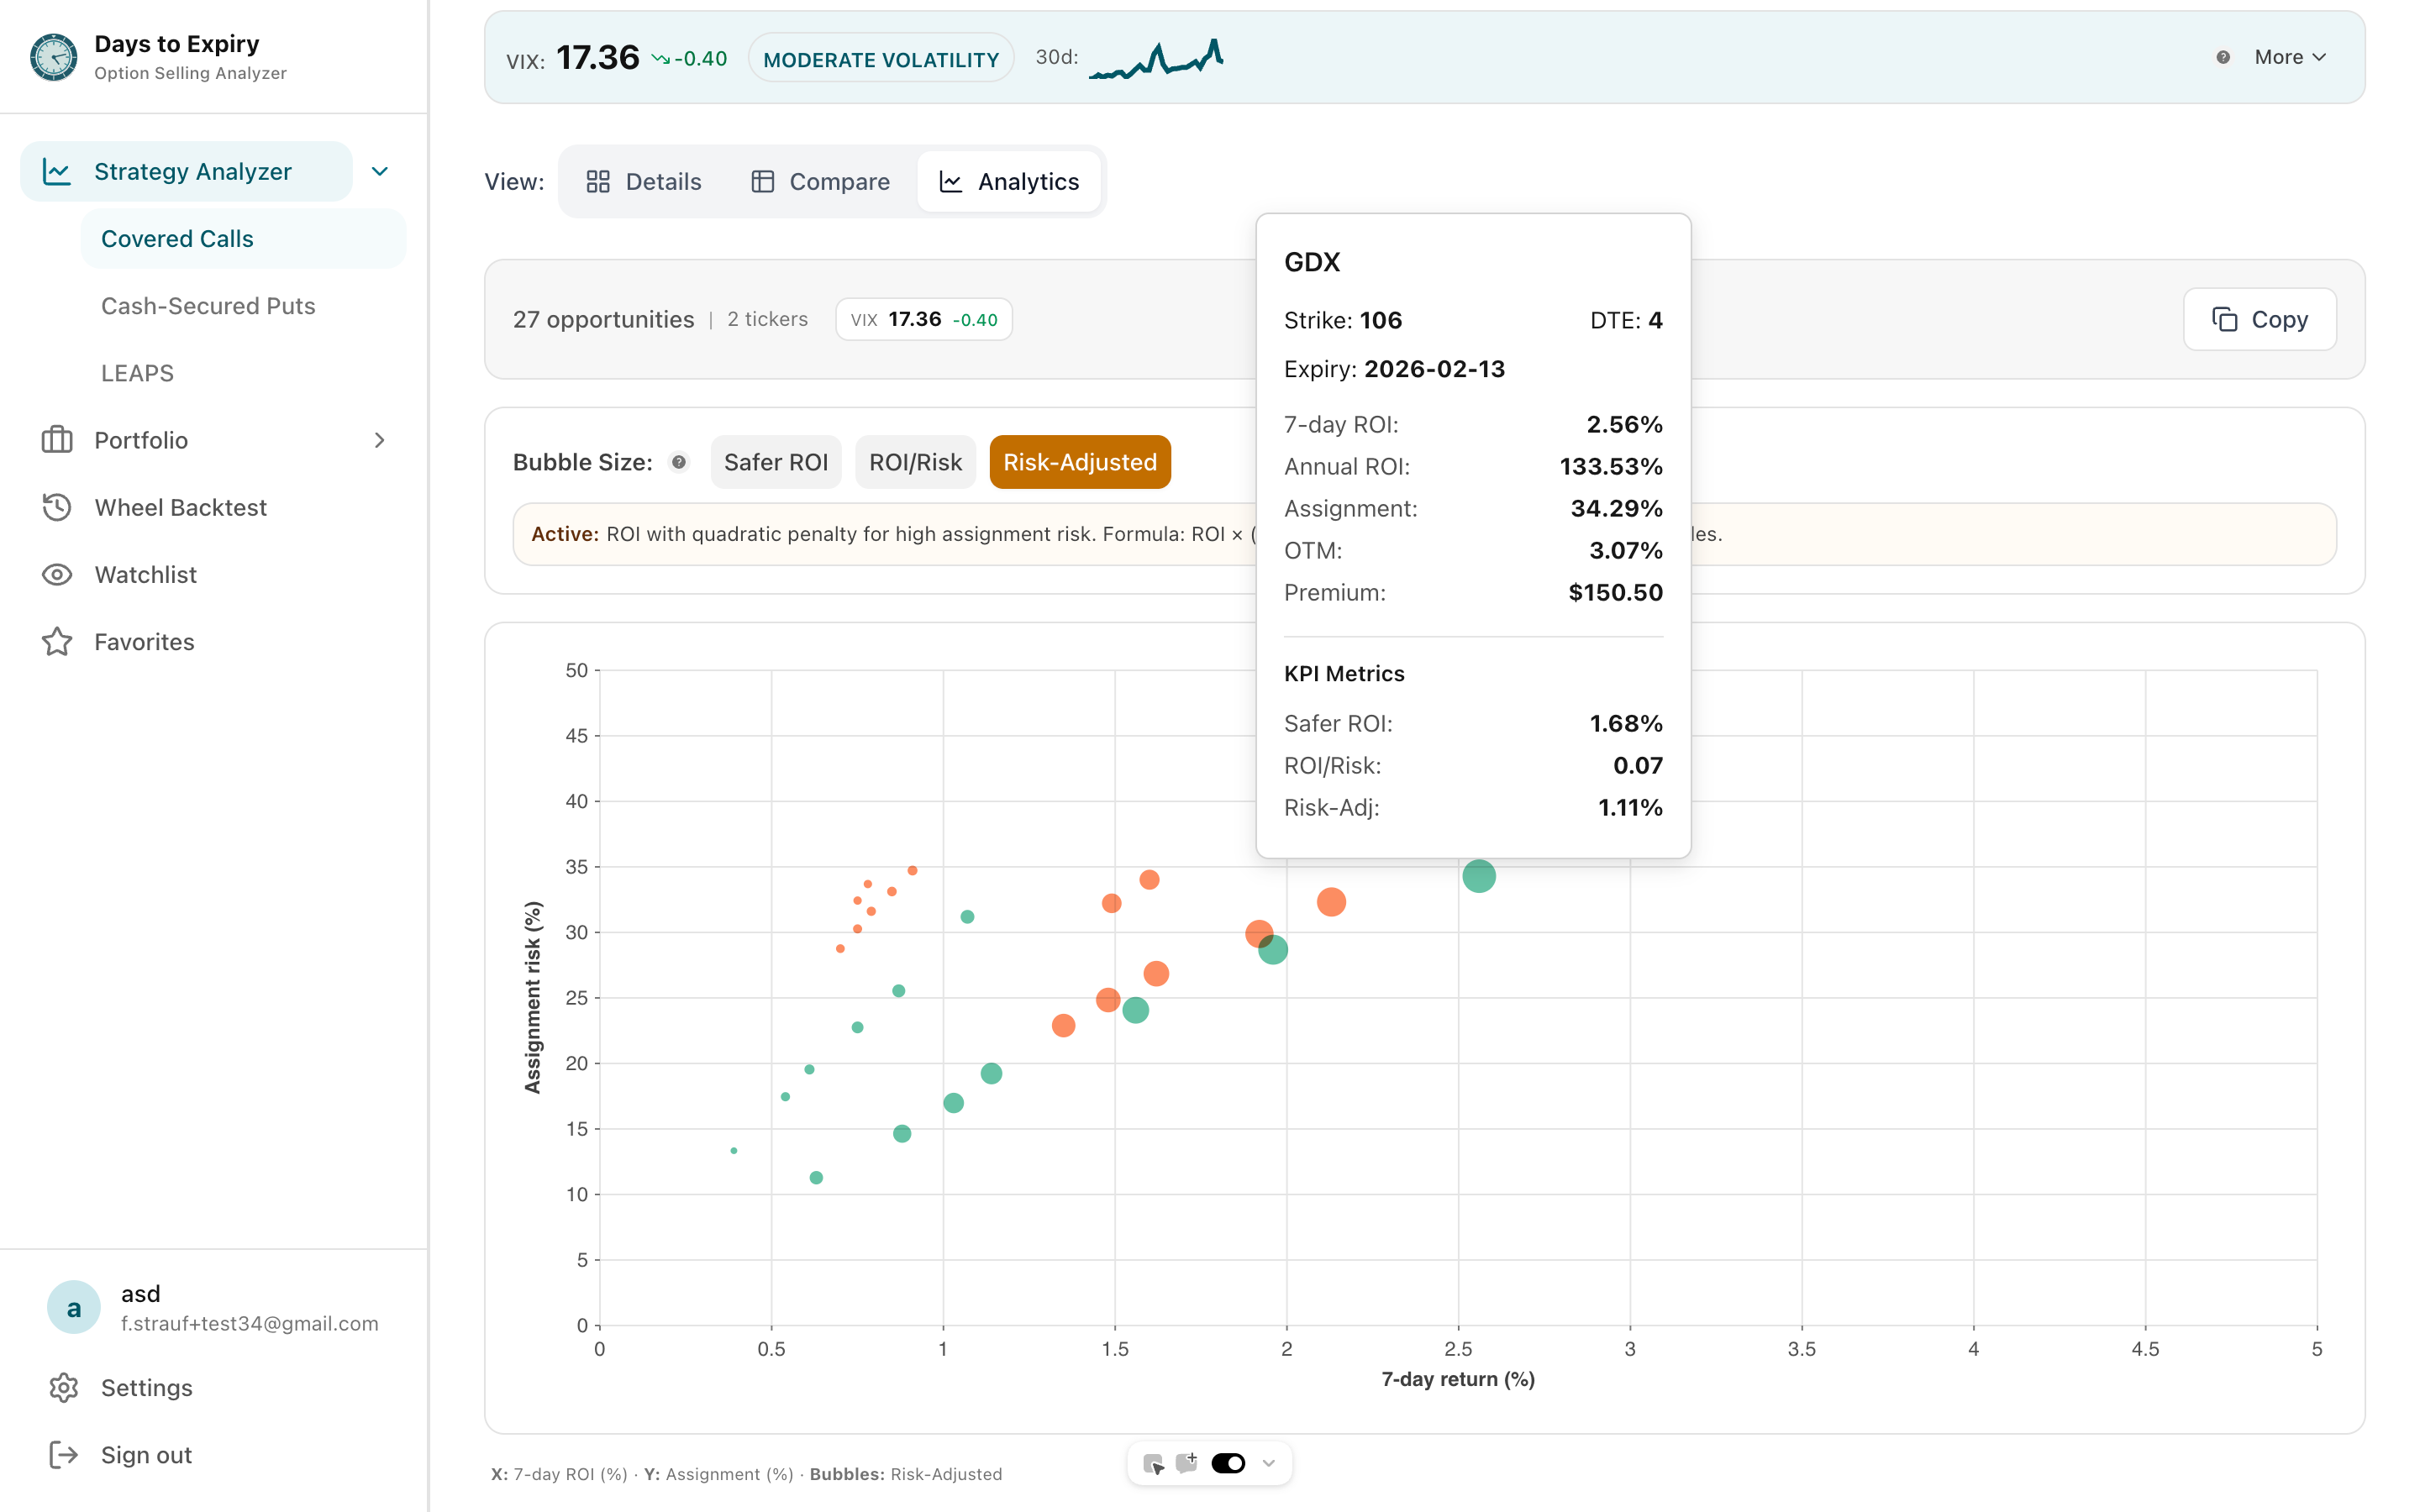
Find high-yield opportunities with built-in backtest data
Wheel strategy opportunities with assignment analysis
Multi-strategy screening with backtested context
Free to start — no credit card required
Everything you need to know about getting started