Days to Expiry — Option Selling Analyzer logo
Days to Expiry
Option Selling Analyzer

The Wheel Strategy Tracker for Interactive Brokers

Systematic Wheel Strategy Execution & Performance Tracking

Running the Wheel strategy across multiple positions? Tired of spreadsheets that don\'t sync with your actual trades? Our tracker connects directly to Interactive Brokers to monitor your CSPs, covered calls, assignments, and income—all updated in real-time.

The Problem: Wheel Strategy Management is Fragmented

1
CSPs and Covered Calls in Different Places — Can't see the full Wheel cycle in one view
2
Assignment Tracking is Manual — You're updating spreadsheets when puts get assigned
3
Income Calculation is Scattered — Premium from puts and calls not consolidated
4
No Visibility Into Wheel Progress — Can't track which positions are in put phase vs call phase
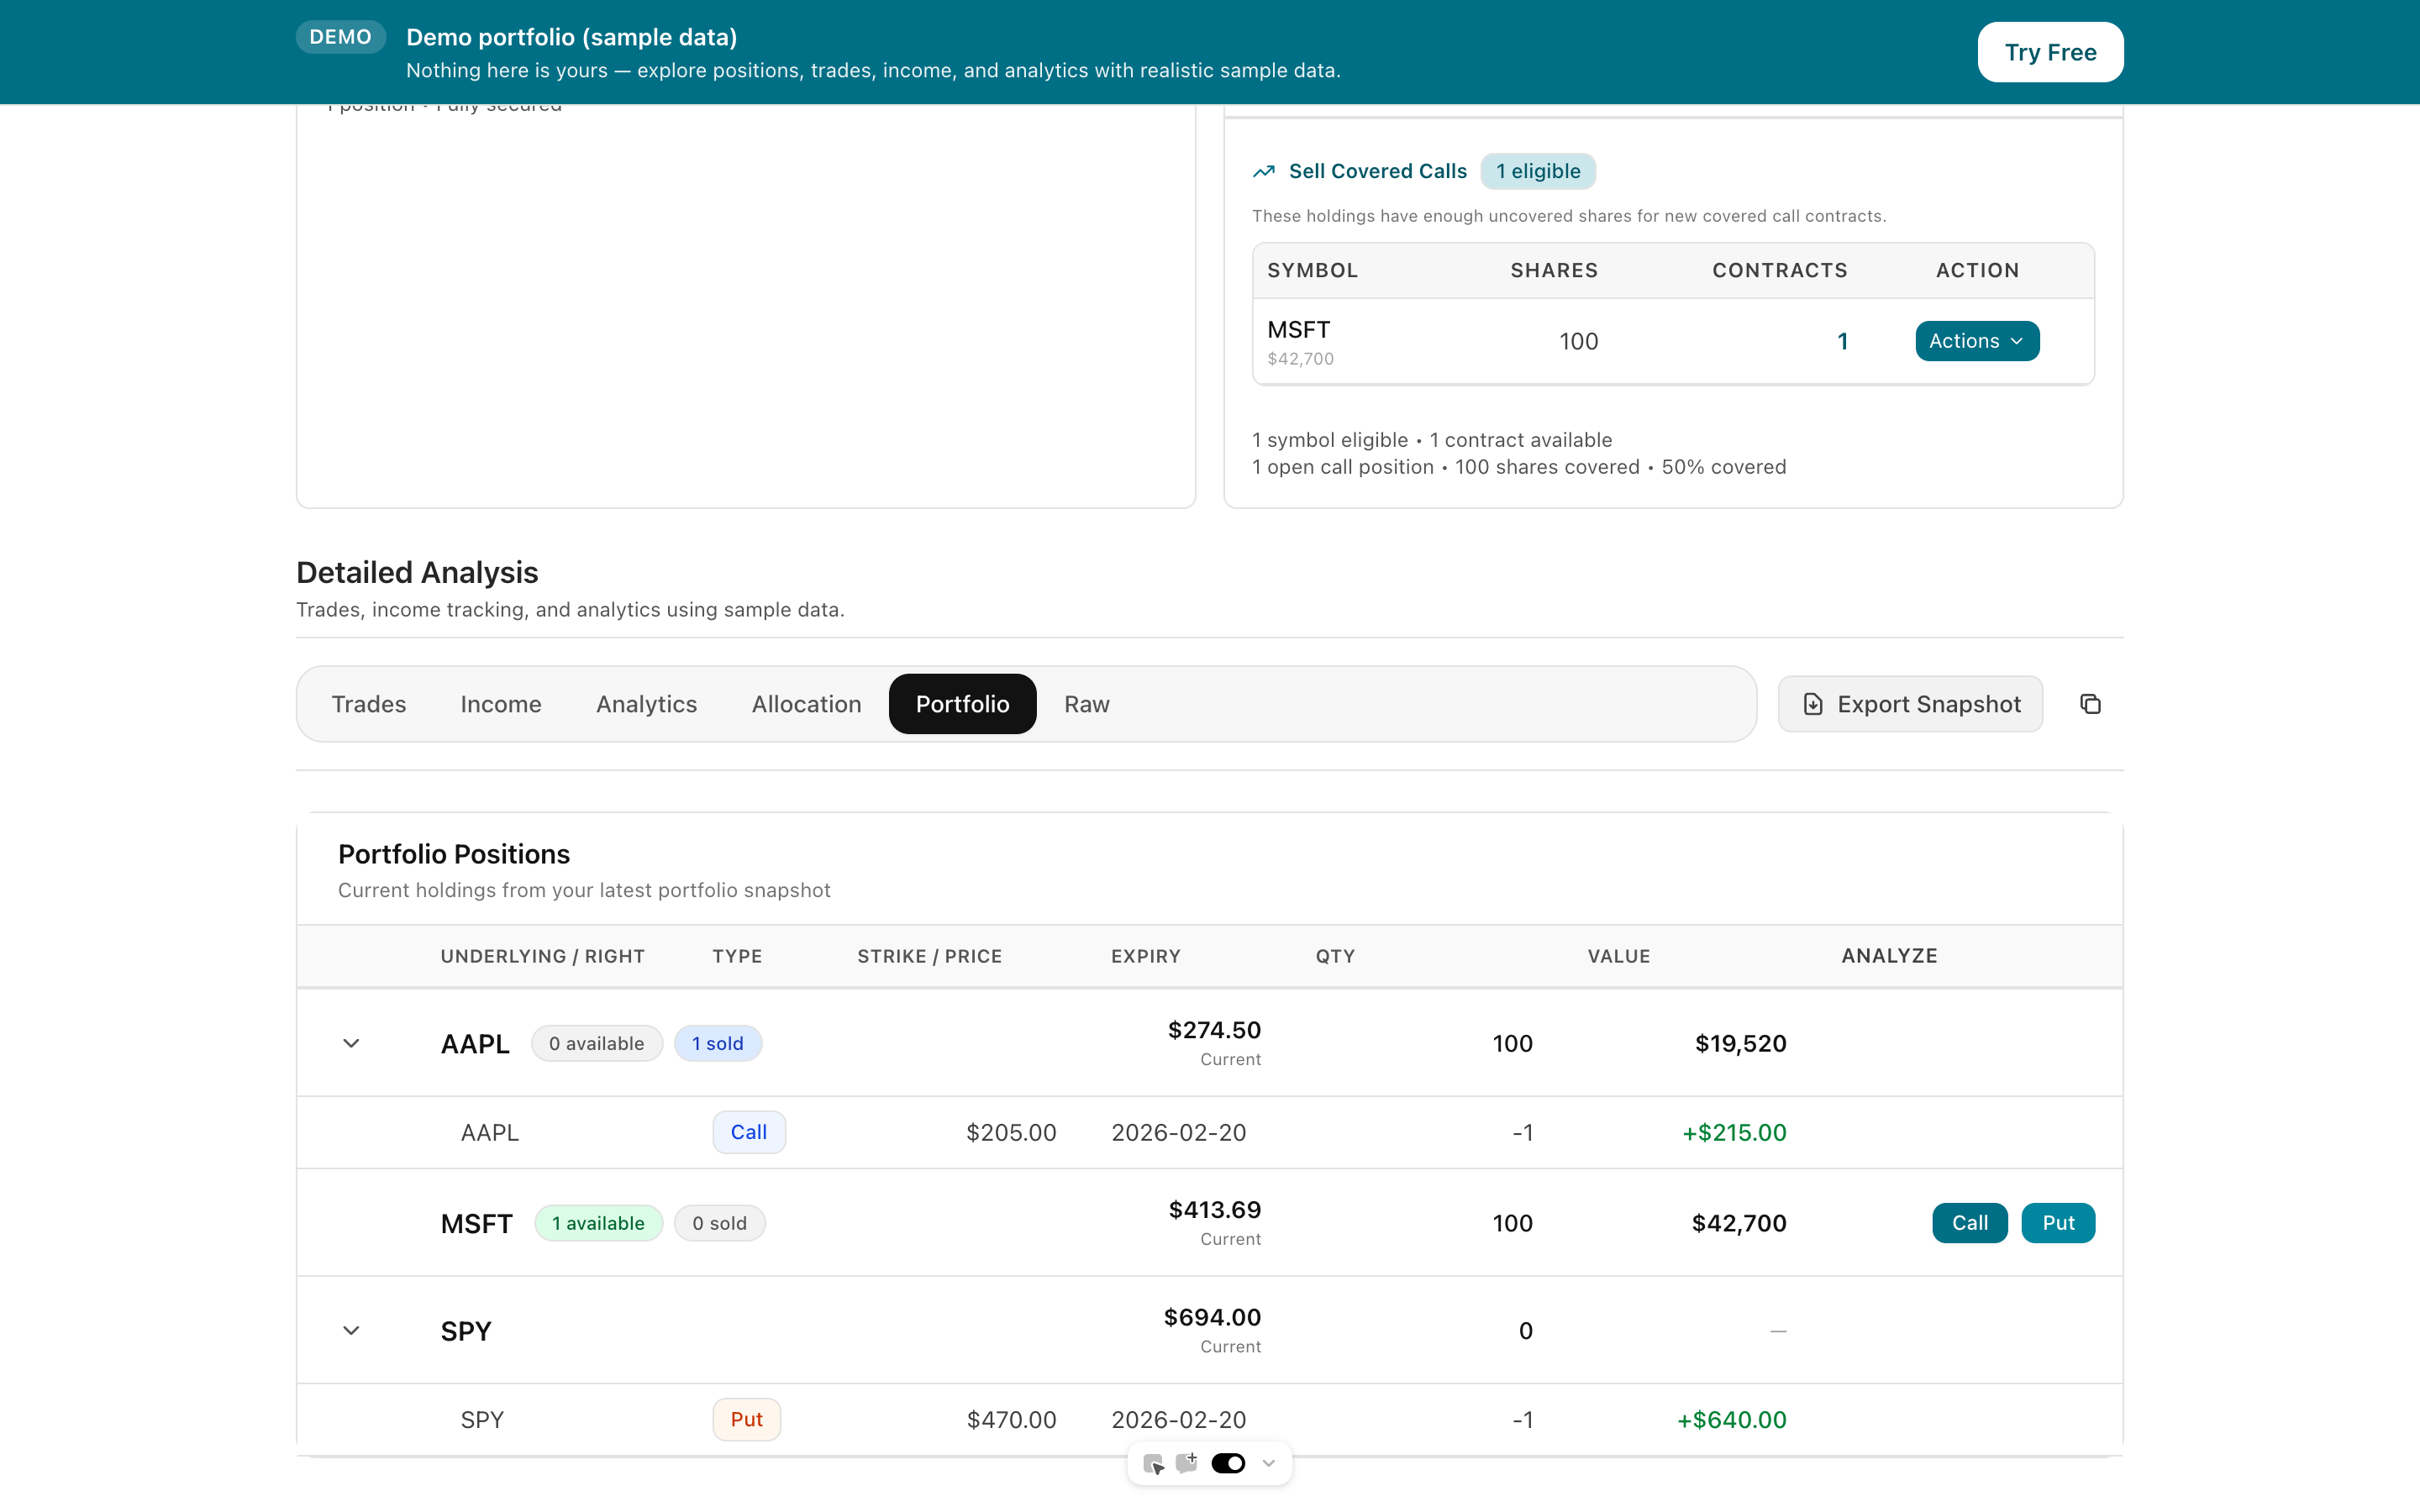
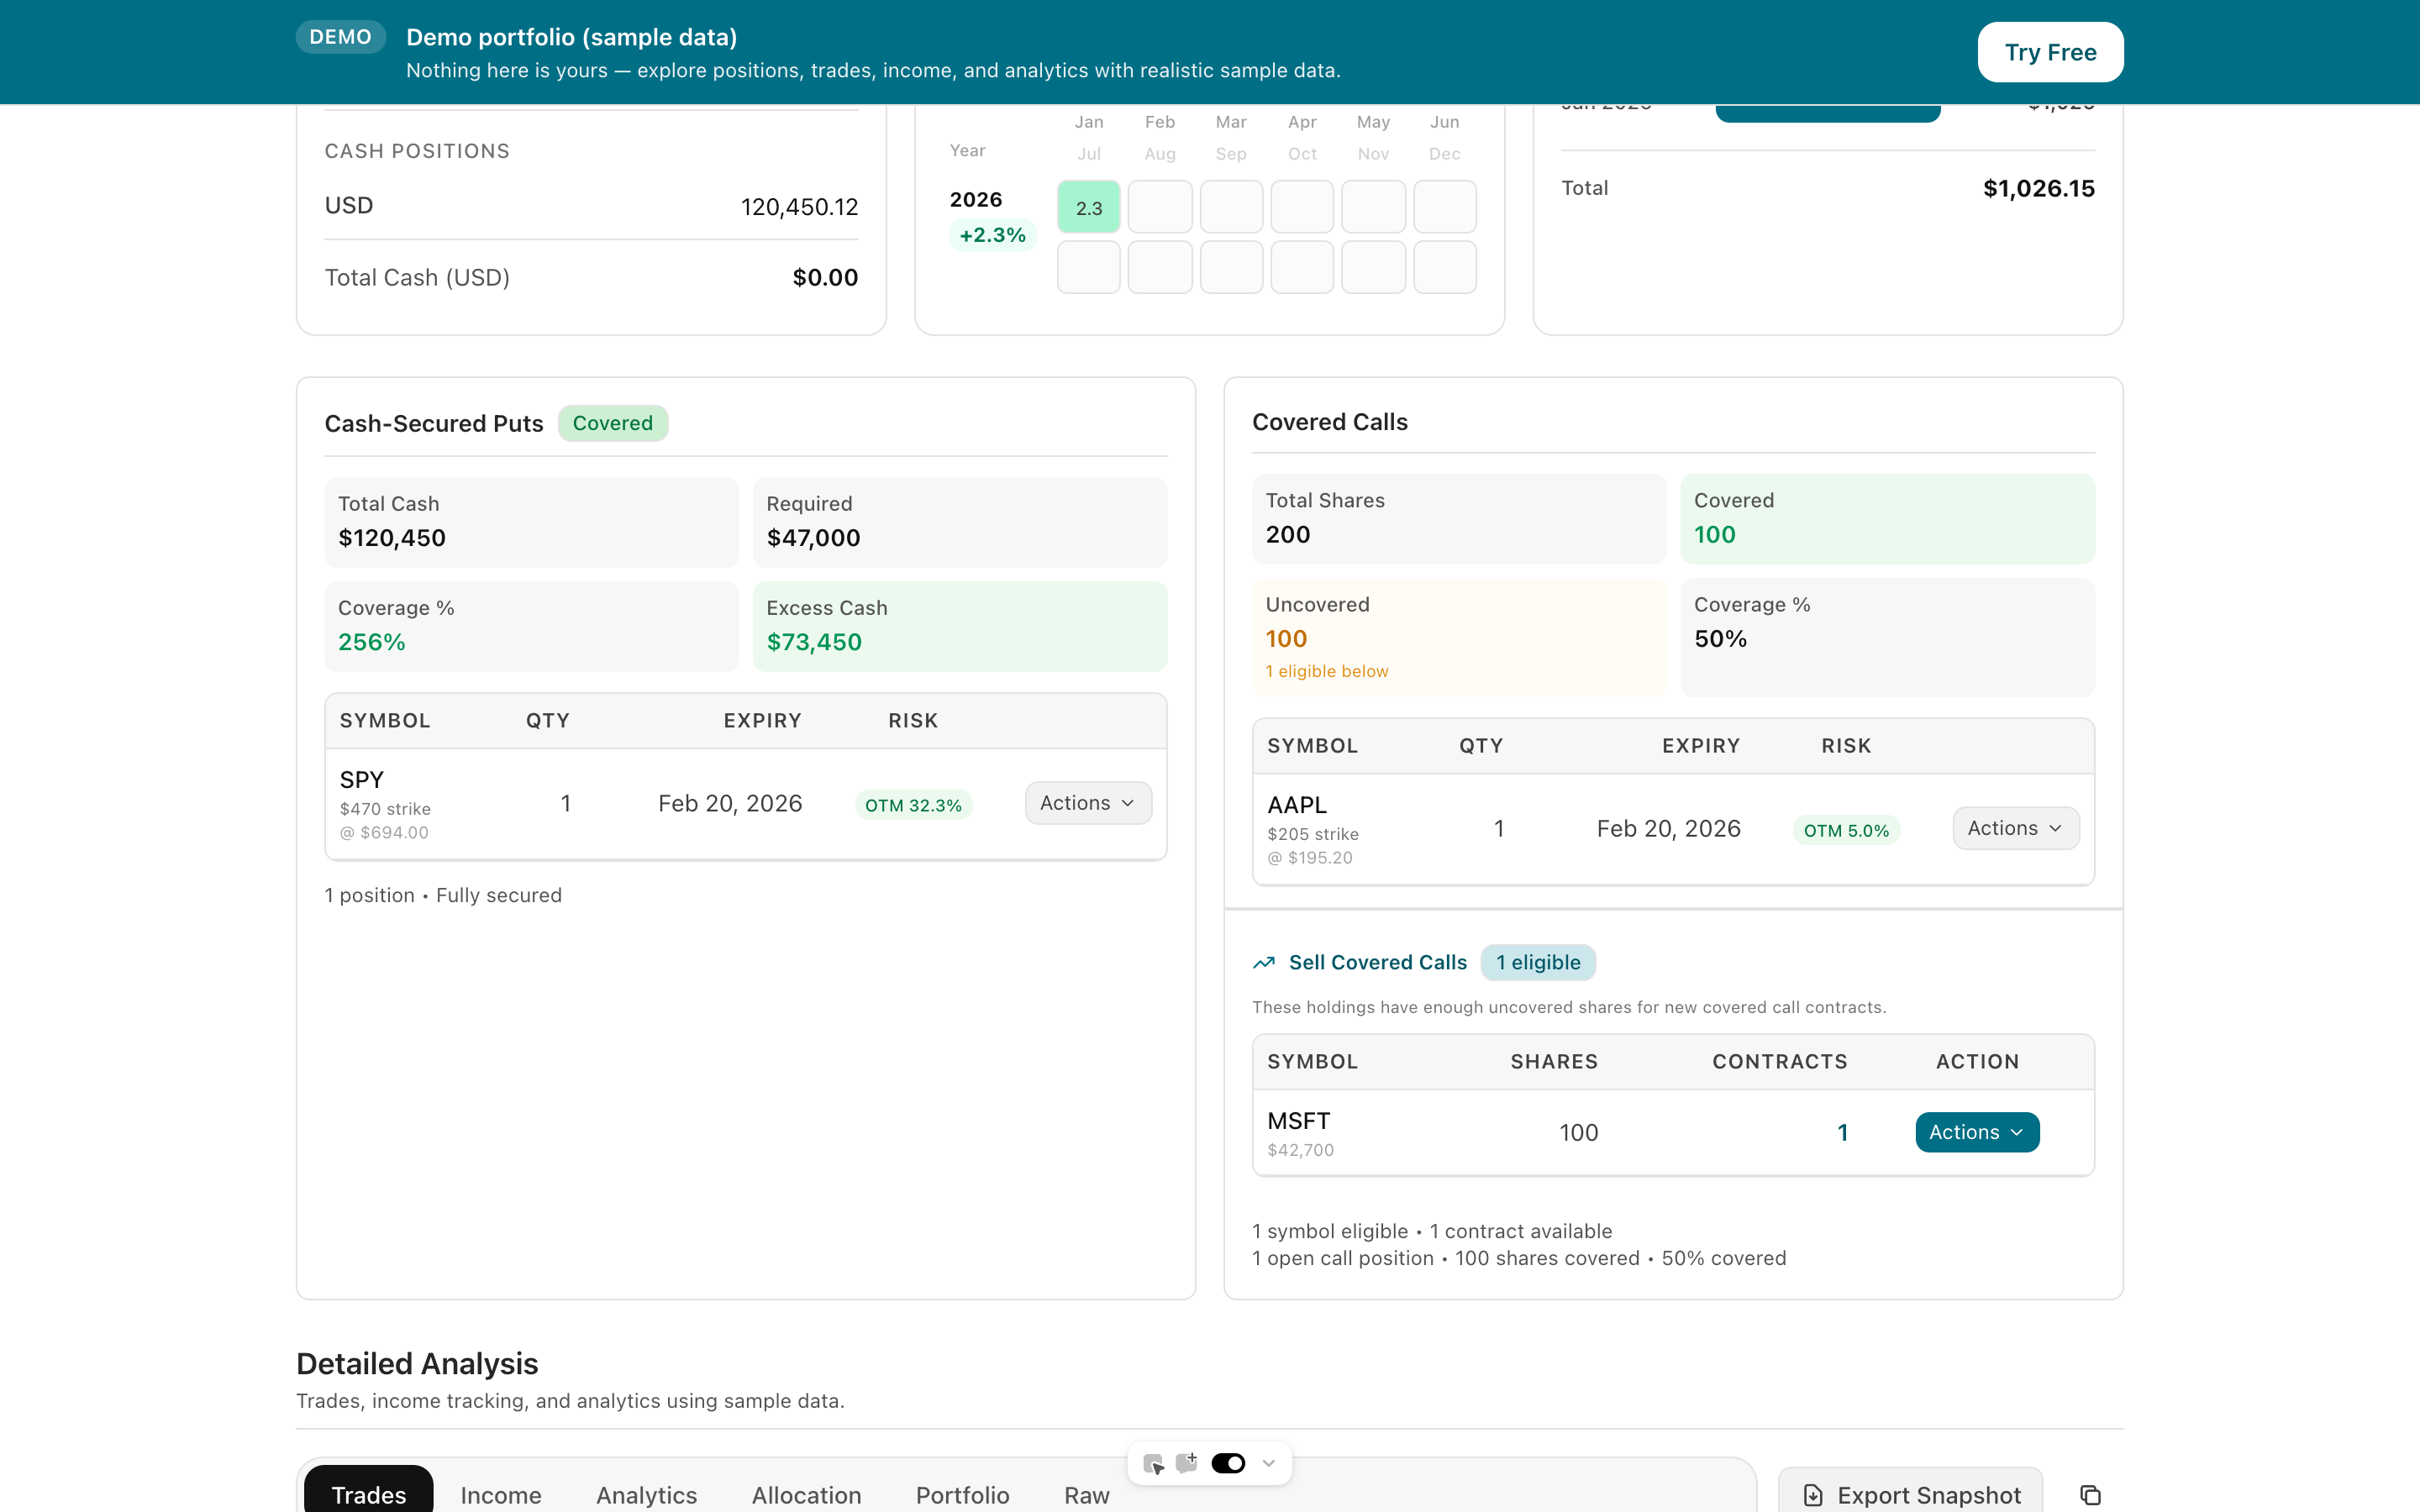
The Solution: Integrated Wheel Strategy Tracking

✅ Full Wheel Cycle View — Track CSP → Assignment → Covered Call in one place

✅ Automatic Assignment Detection — IB sync detects when puts get assigned

✅ Consolidated Income Tracking — Combined premium from puts and calls

✅ Phase-Based Position View — Instantly see which stage each position is in

✅ Wheel Performance Metrics — ROI per Wheel cycle, annualized returns

✅ Historical Assignment Analysis — Track assignment rates by ticker

How It Works

1

Connect Interactive Brokers

Secure Flex Query connection imports your options trades automatically

2

Track Wheel Positions

See all your CSPs, assignments, and covered calls in a unified Wheel view

3

Monitor Cycle Performance

Track income per Wheel cycle from initial put to final call assignment

Real Example: AAPL Wheel Position Tracking

The Wheel Cycle:

Phase 1: Cash-Secured Put
  • Sold: AAPL $175 Put for $2.10 premium
  • DTE: 21 days | Annualized ROI: 32%
  • Status: Expired worthless ✓
  • Profit: $210 premium collected
Phase 2: Cash-Secured Put (Repeat)
  • Sold: AAPL $170 Put for $1.85 premium
  • DTE: 14 days | Annualized ROI: 38%
  • Status: Assigned at $170
  • Profit: $185 premium collected
Phase 3: Covered Call (Current)
  • Own: 100 shares at $170 basis
  • Sold: AAPL $180 Call for $1.50 premium
  • DTE: 14 days remaining
  • Max Profit: $1,150 ($10 capital gain + $150 premium)

Wheel Summary (AAPL):

Total Premium Collected

$545

Days in Wheel

45 days

Current Position Value

$17,650

Unrealized Gain

+$650

Key Metrics

Avg Wheel Cycle Return

4.2%

Assignment Rate

23%

Monthly Premium Income

$1,850

Active Wheel Positions

12

Related Resources

Wheel Strategy Calculator

Calculate returns for complete Wheel cycles

Cash-Secured Put Calculator

Analyze CSP entry points for Wheel initiation

Covered Call Analyzer

Optimize covered call strikes during Wheel Phase 2

Interactive Brokers Options Trading Journal

Complete trade logging with IB sync

Cash-Secured Puts vs Covered Calls

Compare the two main Wheel strategy components

Frequently Asked Questions

What is the Wheel strategy?

The Wheel is a systematic options strategy: (1) Sell cash-secured puts until assigned, (2) Once assigned, sell covered calls on those shares until called away, (3) Repeat. It generates consistent premium income while potentially accumulating shares at desired prices.

How does the tracker detect Wheel phases?

Our system analyzes your IB portfolio to identify: (1) Open short puts = Wheel Phase 1, (2) Long shares without covered calls = Between phases, (3) Long shares with short calls = Wheel Phase 2. Automatic detection updates as positions change.

Can I track multiple Wheel positions?

Yes. The dashboard shows all active Wheel positions across different tickers, each with their current phase, days in cycle, premium collected, and projected returns. Filter by phase, ticker, or DTE.

What metrics does the Wheel tracker calculate?

Key metrics include: premium collected per cycle, annualized Wheel ROI, assignment rate by ticker, average days per phase, total Wheel income, and cost basis reduction from premium collection.

Does it work if I start mid-Wheel?

Yes. If you already own shares or have open puts, the tracker will identify your current position and start tracking from there. Historical IB data can also reconstruct past Wheel cycles.

How often does IB data sync?

Flex Query sync typically updates every 15-30 minutes during market hours. Manual refresh is available anytime. All options trades, assignments, and expirations are captured automatically.

Ready to Get Started?

Join traders who are already using our tools to make better decisions.

The Wheel Strategy Tracker for Interactive Brokers | Wheel Options | Days to Expiry — Option Selling Analyzer