Connect your IBKR account and instantly see your options income by week, month, and year — broken down by ticker, strategy, and DTE bucket. Built for covered call and cash-secured put sellers.
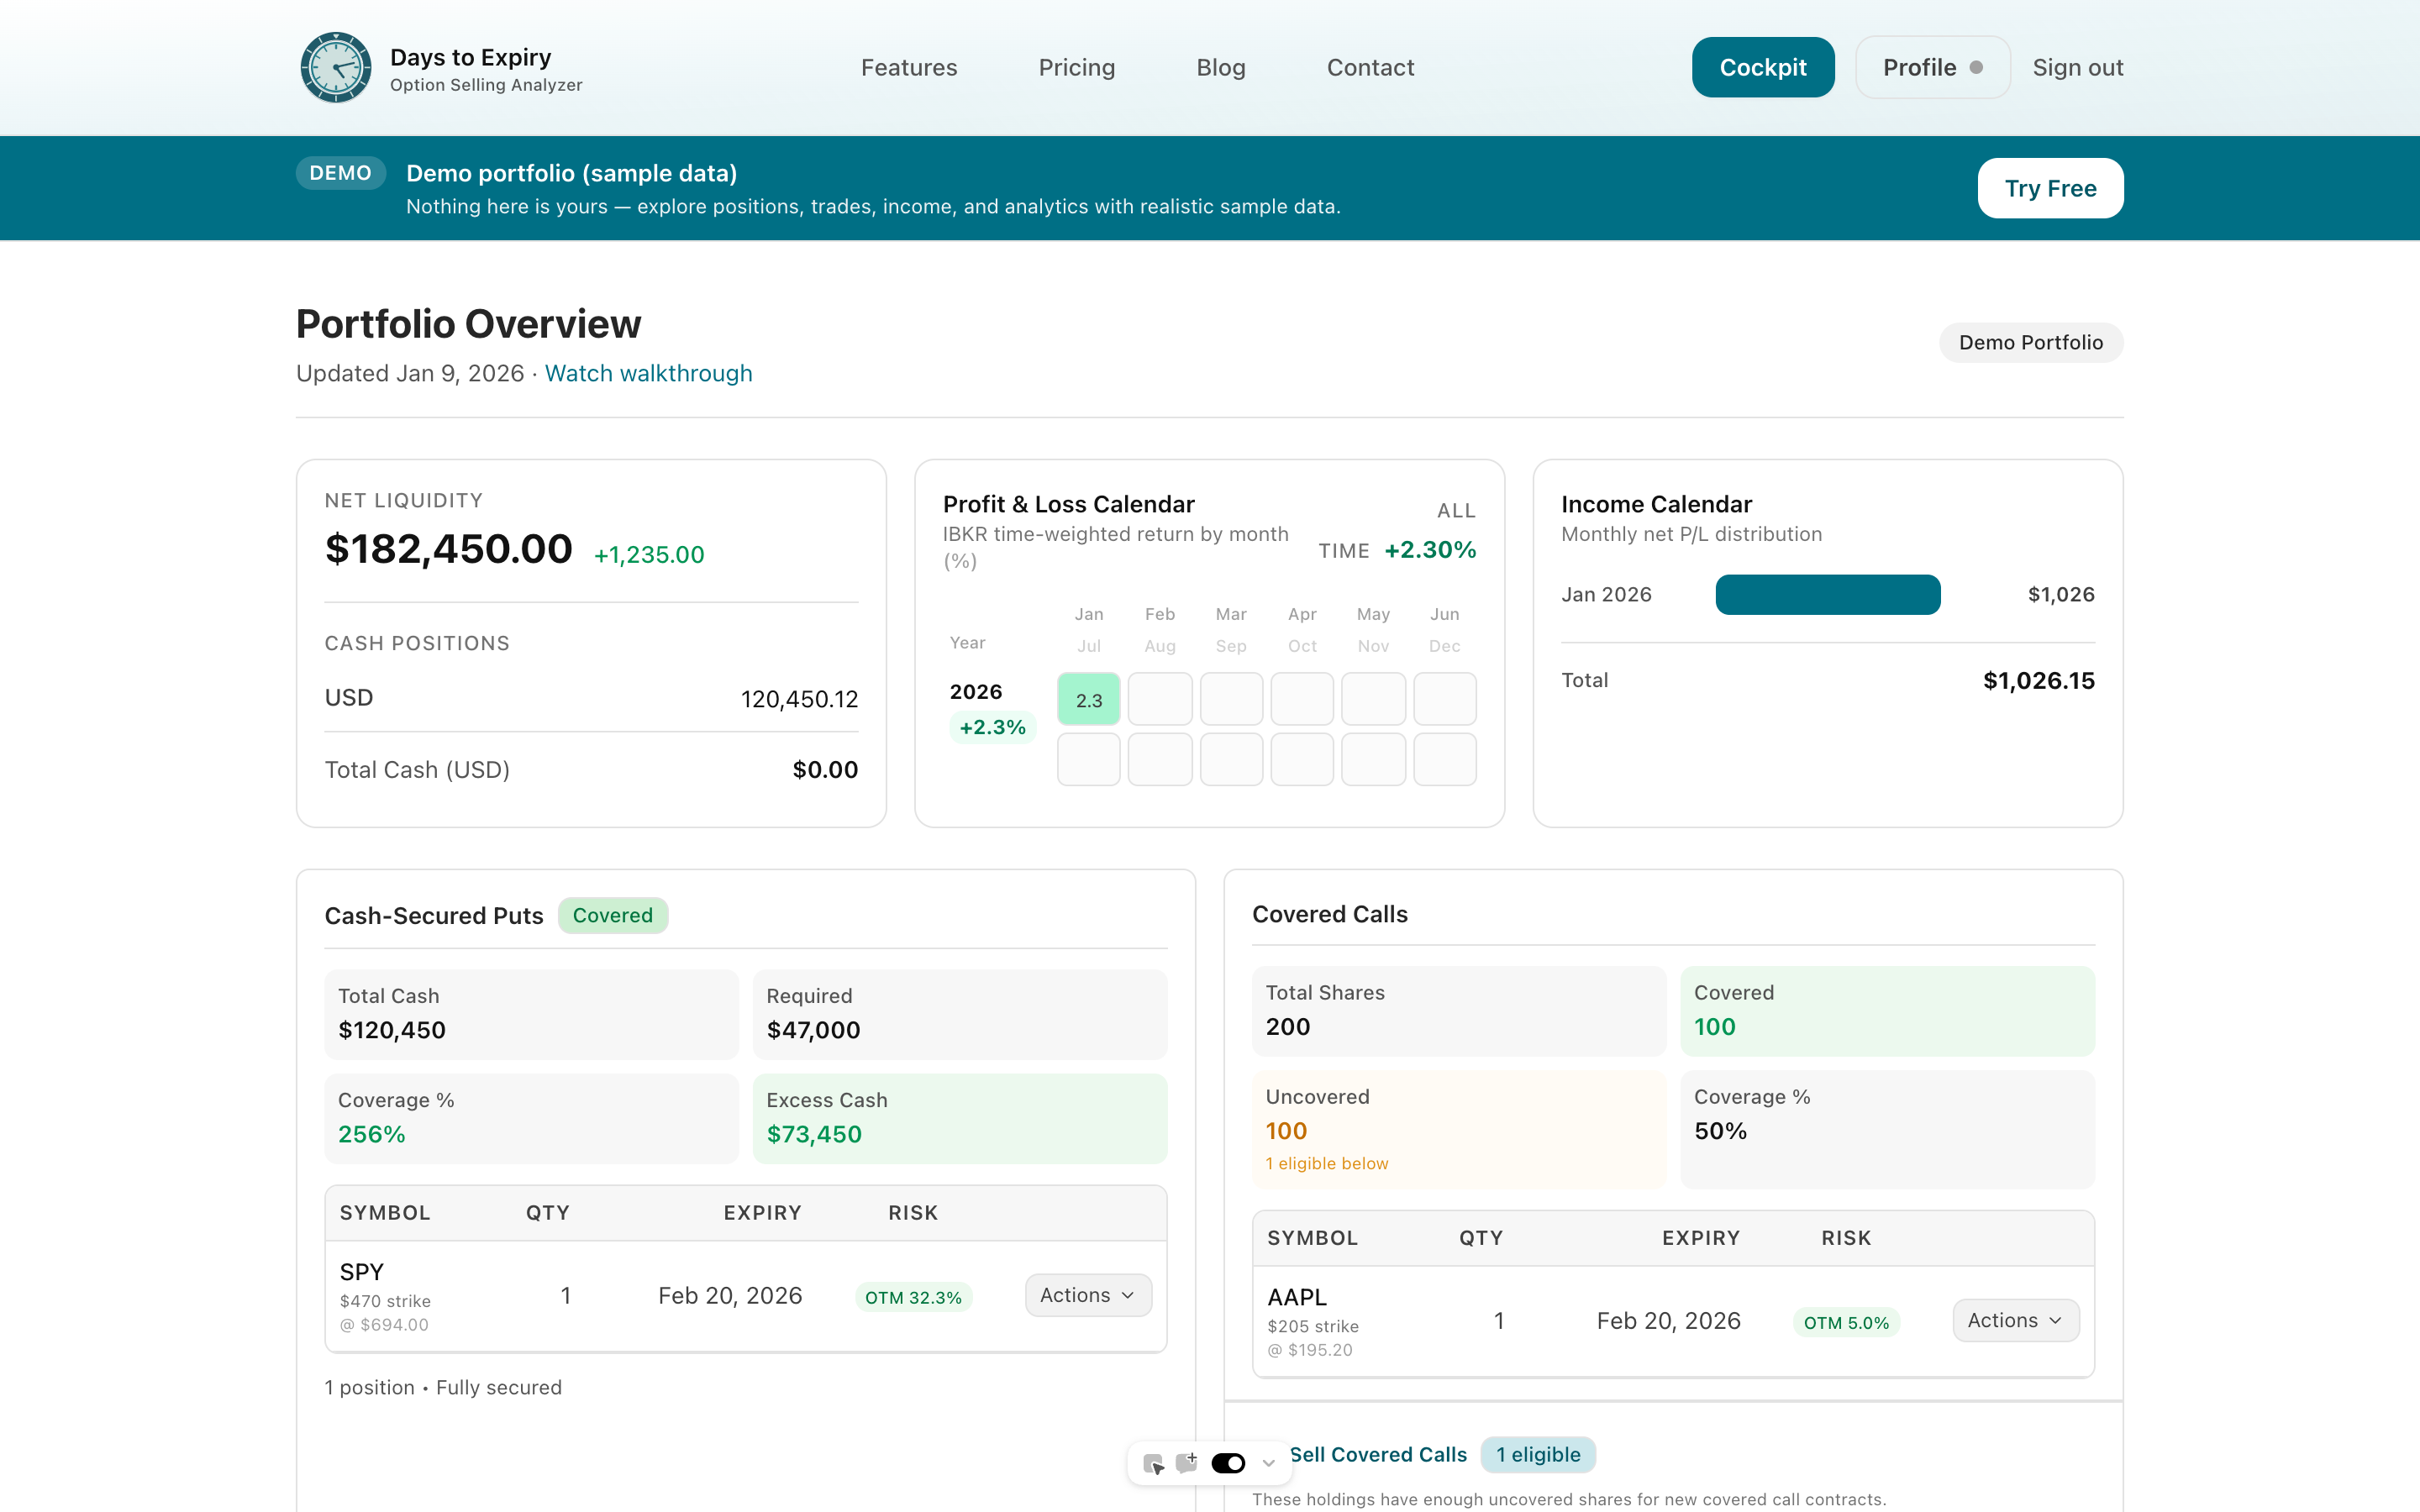
You're selling covered calls and cash-secured puts every month, but you have no clean view of how much income you've actually generated. Your brokerage shows closed P&L mixed in with unrealized positions. Your spreadsheet is always a few trades behind. You can't easily answer 'how much did I make selling options last quarter?' Days to Expiry is an options income tracker built specifically for sellers. Connect your IBKR account once — your trades sync automatically. You get a dedicated income dashboard that separates premium collected from capital gains, organizes it by time period and ticker, and shows you the metrics that matter for a systematic income strategy.
Tap to view full size
P&L Not Income — Your broker mixes premium collected with unrealized stock positions; there's no clean "income earned selling options" view
Spreadsheet Lag — Manual updates mean your tracker is always a few trades behind, and you're always doing ROI math by hand
No Per-Ticker View — No easy way to see which underlying stocks are generating the most premium income for you each month
No Expired Worthless Rate — You can't see what percentage of your options expire worthless, a key metric for income sellers
Weekly bar chart, monthly totals, and a running YTD figure; filter by covered call, CSP, or strategy type.
Connect once via Flex Query; every expired, closed, or assigned option is automatically imported and categorised.
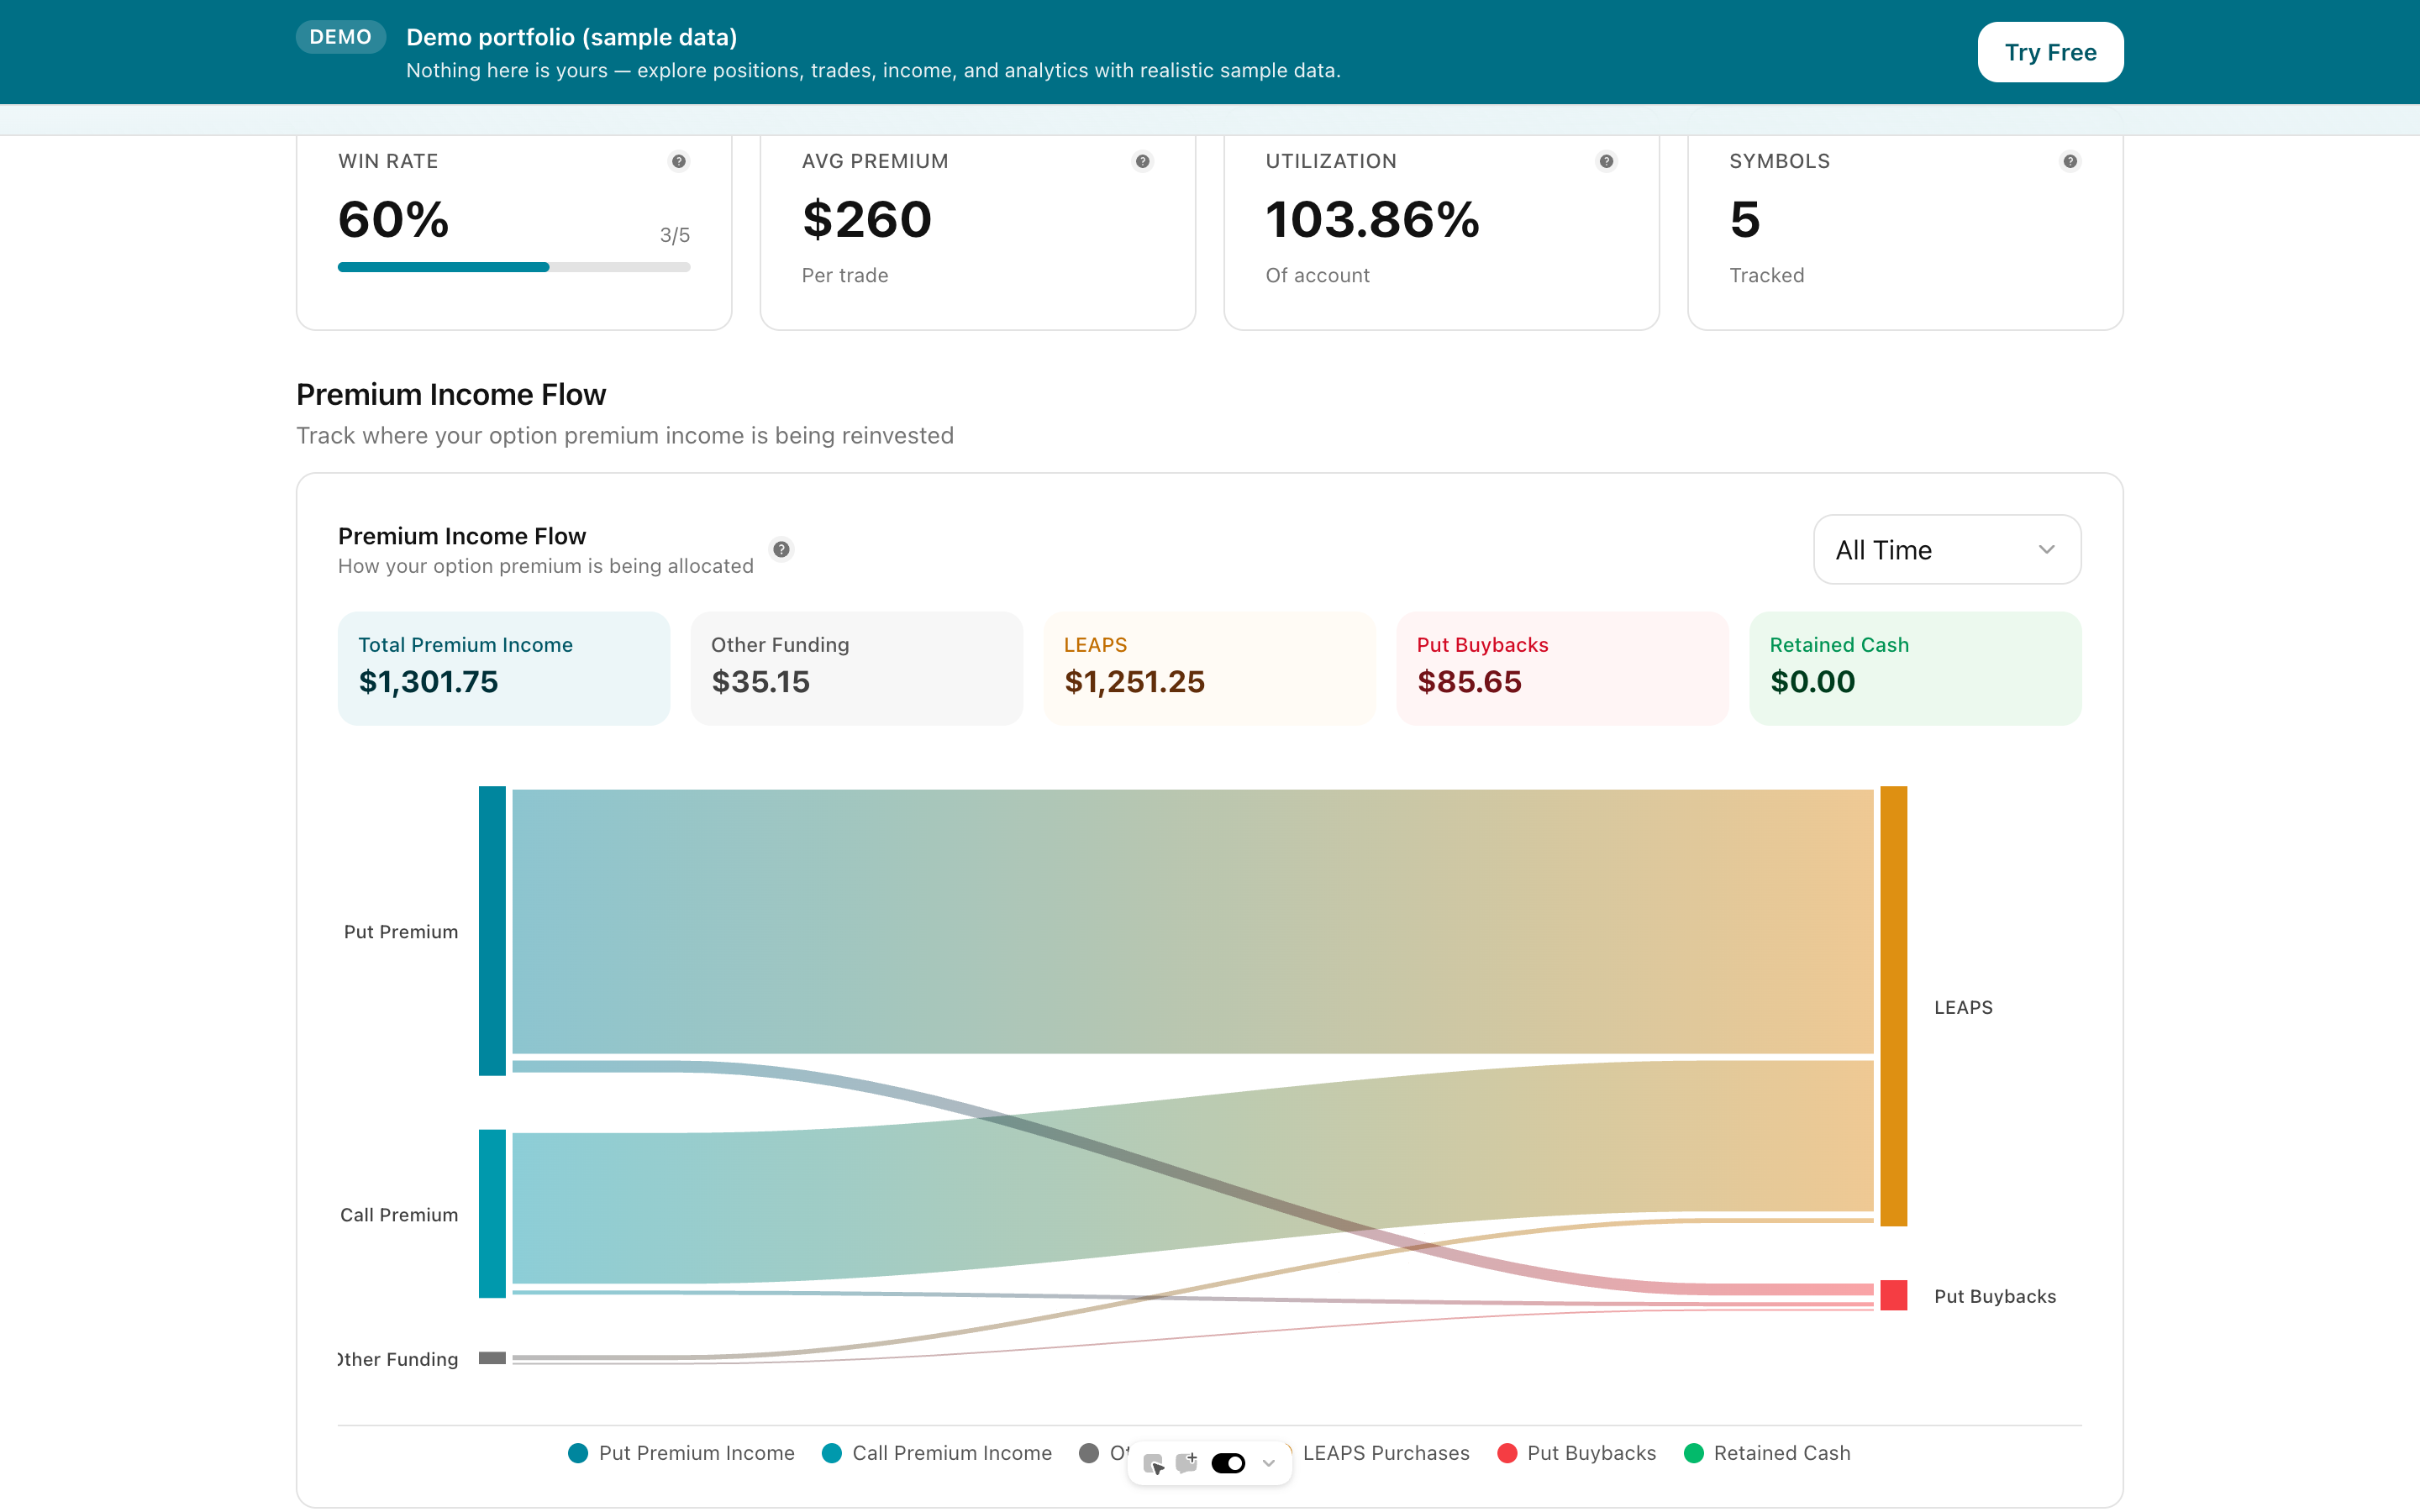
Total premium collected, average premium per contract, number of trades, and annualised yield per underlying.
Break down income by DTE bucket (0–7, 8–21, 22–45 days) and see which timeframes generate the most reliable premium.
Tap to view full size
Link your Interactive Brokers account via Flex Query — takes under 5 minutes. Days to Expiry imports your complete options trade history immediately.
Your trades are automatically categorised by strategy type and underlying. A dedicated income view shows premium collected as income over time — not P&L mixed with unrealized positions.
Drill into per-ticker income breakdowns. See which stocks pay you the most premium, compare covered call vs. CSP income, and identify which DTE buckets perform most consistently for your strategy.
Income View
Premium, not P&L
Sync
Auto daily
Setup Time
< 5 min
Manual Entry
Zero
How to connect your Interactive Brokers account
Covered call specific tracking with roll history and lifecycle view
Full portfolio view with expiry calendar and position-level detail
Free to start — no credit card required
Everything you need to know about getting started