Days to Expiry — Options Portfolio Tracker logo
Days to Expiry
Options Portfolio Clarity

Covered Call Calculator

Calculate Premium, Breakeven & Annualized Return in Real-Time

Tired of spreadsheet math before every covered call? Our covered call calculator shows you exact premium income, breakeven, downside protection, and annualized ROI—before you place the trade.

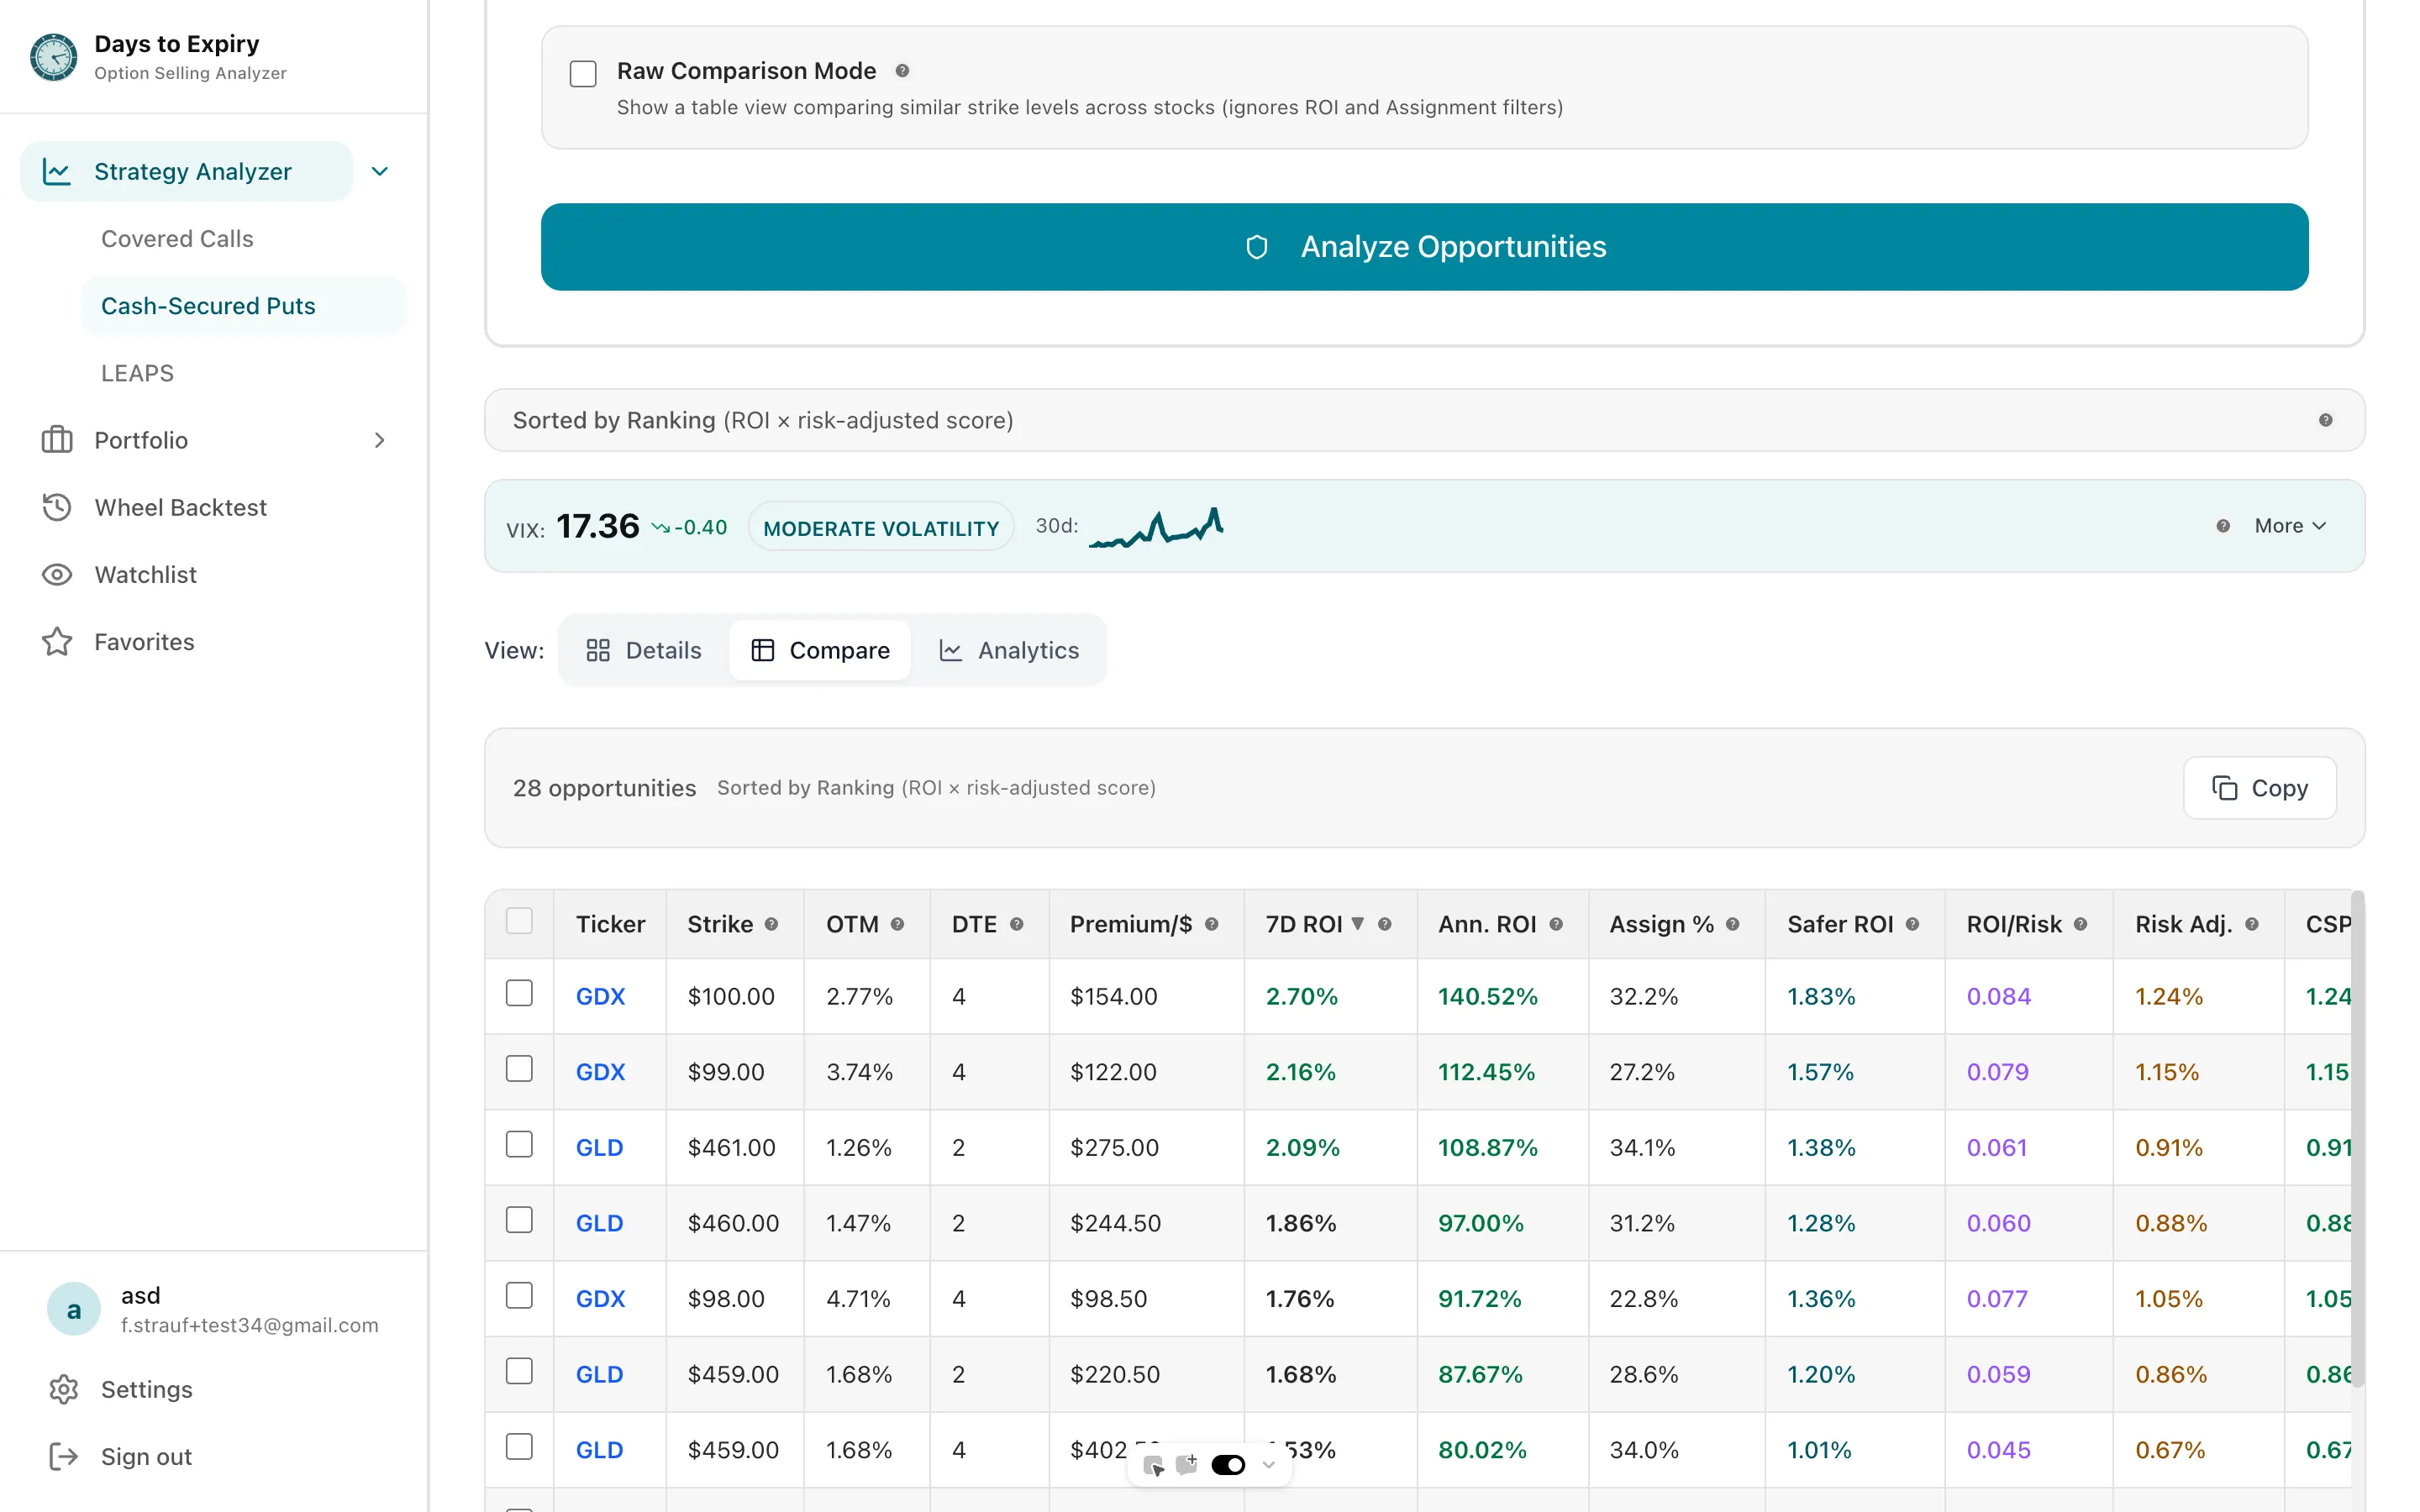
Covered call strategy comparison

Tap to view full size

Problem

Manual Covered Call Analysis is Broken

Missing Annualized Returns — Raw premium looks good until you compare 14-day vs 45-day trades

No Real-Time Assignment Probability — You're selling calls without knowing how likely shares get called away

Fragmented Data Across Tools — Premium from your broker, Greeks from a chart, ROI from a spreadsheet

Solution

Covered Call Calculator

Premium Collected

Exact dollars earned upfront

Breakeven Price

Where you profit/lose if the stock drops

Downside Protection %

Cushion from the premium you collect

Assignment Probability %

Odds your shares get called away

Annualized ROI

Compare trades of any DTE fairly

Static vs If-Called Return

Both outcomes, side by side

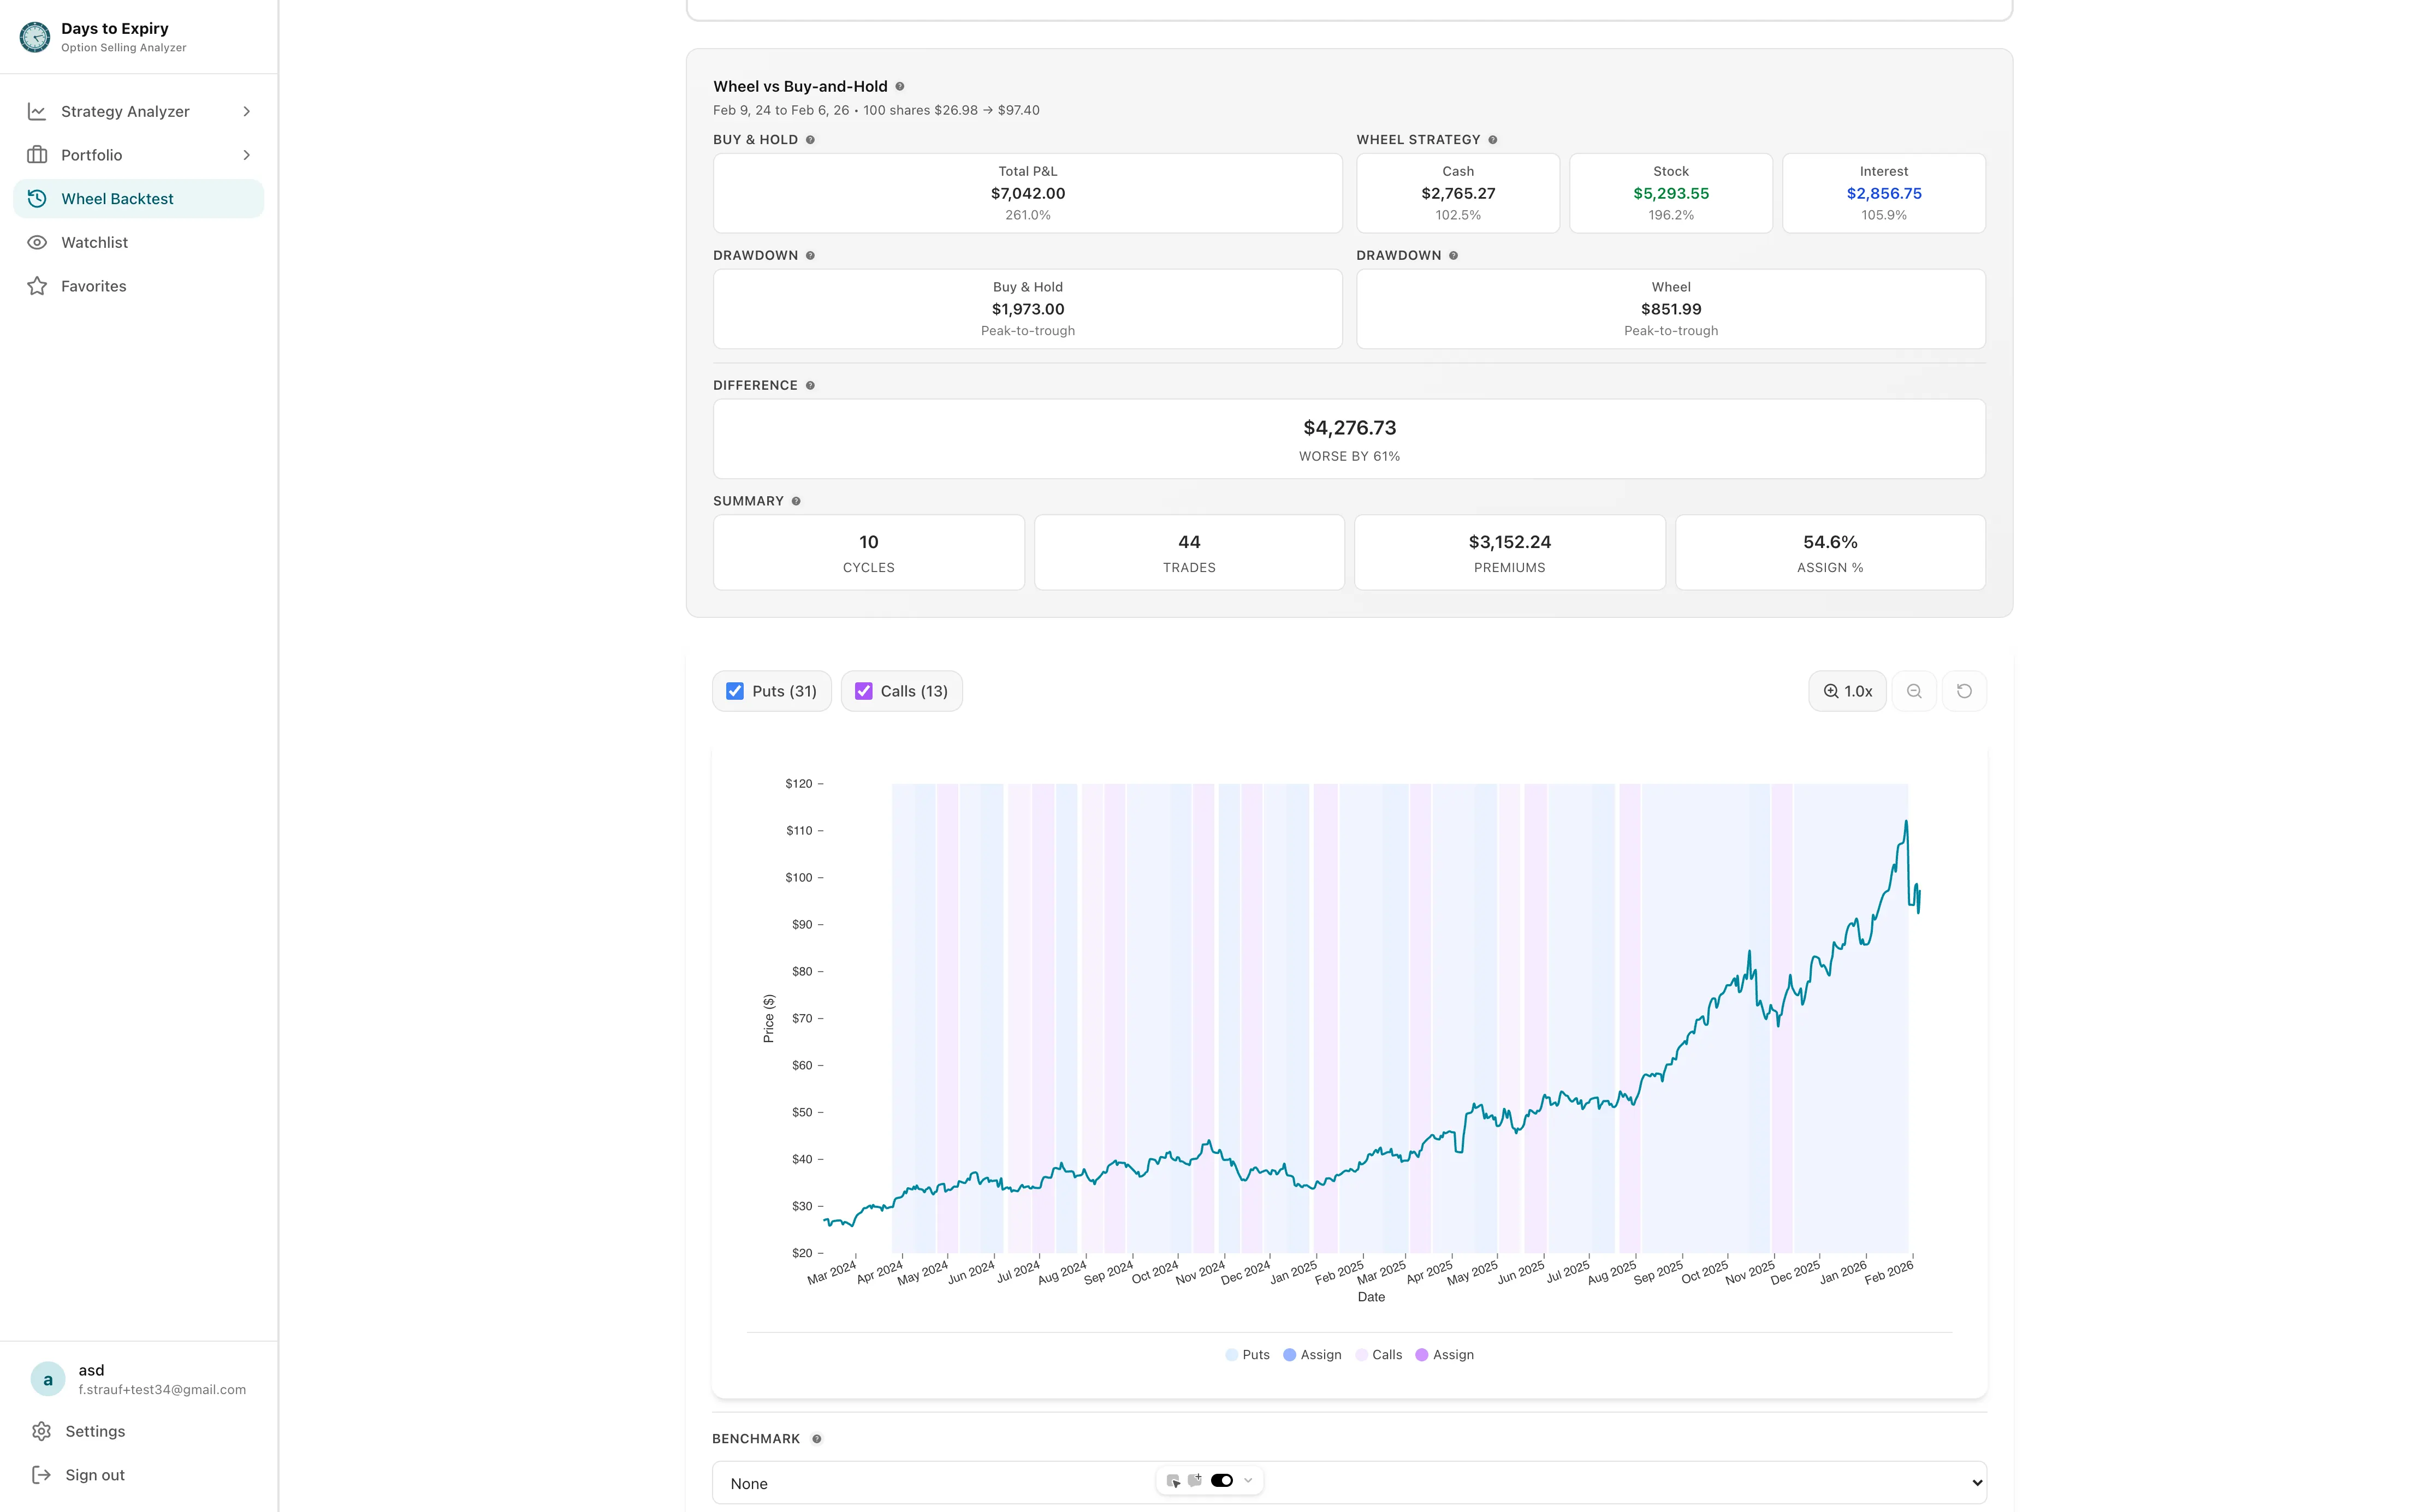
Backtest covered call strategy showing historical performance

Tap to view full size

Try It Now: Calculate Your Covered Call

Monthly Income Calculator

Estimate income from selling covered calls or cash-secured puts

$580.00

Need more capital to start

Try $58,000 or switch strategies

How it works

Get started in 3 simple steps

1

Enter Your Position Parameters

Ticker, shares you own, cost basis, call strike, premium, and days to expiration

2

Review Your Metrics Instantly

See exact premium, breakeven, downside protection, static vs if-called return, and assignment odds

3

Make Confident Trade Decisions

Compare strikes side-by-side, test what-if scenarios, and only sell when the math makes sense

Real Example: Using the Covered Call Calculator

Scenario: Selling a Covered Call on MSFT

  • Own 100 shares at $420 cost basis
  • Current stock price: $432
  • Strike: $430 (sell call here)
  • Premium collected: $2.10 per share
  • DTE: 30 days

Calculator shows:

  • Premium income: $210 per contract
  • Breakeven: $417.90 (cost basis − premium)
  • Downside protection: 0.5% cushion ($2.10 / $420)
  • Max profit if assigned: $1,210 ($10 capital gain × 100 + $210 premium)
  • Assignment probability: 22%
  • Static return: 0.5% (≈6% annualized if not assigned)
  • If-called return: 2.9% (≈35% annualized if assigned)

Trader insight: Modest premium with low assignment risk. Strong if-called yield if you're fine selling MSFT at $430; otherwise step up a strike.

Key Metrics

Breakeven Price

$417.90

Downside Protection

0.5%

Assignment Probability

22%

Annualized ROI

24%

What Income Do You Need?

Use this to work backwards: enter your income goal and see what's required.

Target Income Calculator

Work backwards: set your income goal and find the required capital

Enter your target income to see requirements

Frequently Asked Questions

Everything you need to know about getting started

What's a covered call?

You own 100 shares and sell a call option on that same stock. You collect premium upfront. If the stock rallies above your strike, your shares get called away (assigned). If it stays below, you keep the shares and the premium—and can sell another call next cycle.

How is breakeven calculated?

Breakeven = Cost Basis − Premium Collected. Example: You own shares at $100 and collect $3 premium. Your breakeven is $97. The stock can fall to $97 and you still break even on the combined position.

What's the difference between static and if-called return?

Static return assumes the call expires worthless (stock stays at or below the strike): premium ÷ cost basis. If-called return assumes shares are assigned: (strike − cost basis + premium) ÷ cost basis. Annualize either figure by multiplying by 365 ÷ DTE so you can compare trades of different lengths.

What's assignment probability?

Assignment probability is the historical likelihood that your shares get called away (stock finishes above the strike). Higher delta means higher assignment risk. Use it to decide whether the premium compensates for capping your upside.

Why does DTE (days to expiration) matter?

Shorter DTE = Higher theta decay = More premium per day, but less time to manage if the stock moves. Longer DTE = Lower daily decay = Safer management window, but premium per day is smaller. Most income sellers target 30–45 DTE.

Is higher ROI always better?

No. Higher annualized ROI usually means a closer-to-the-money strike (higher assignment risk) or shorter DTE (less time to recover). Optimal covered calls balance acceptable assignment probability, ROI matching your goals, and whether you are willing to sell the stock at the strike.

Ready to Get Started?

Join traders who are already using our tools to make better decisions.