Smarter analysis, clearer guidance, and deeper insights into every position. Here is everything we have shipped recently.
Outcome: Know whether to enter now or wait for a better setup.
For sellers who want entry timing backed by context, not gut feel.
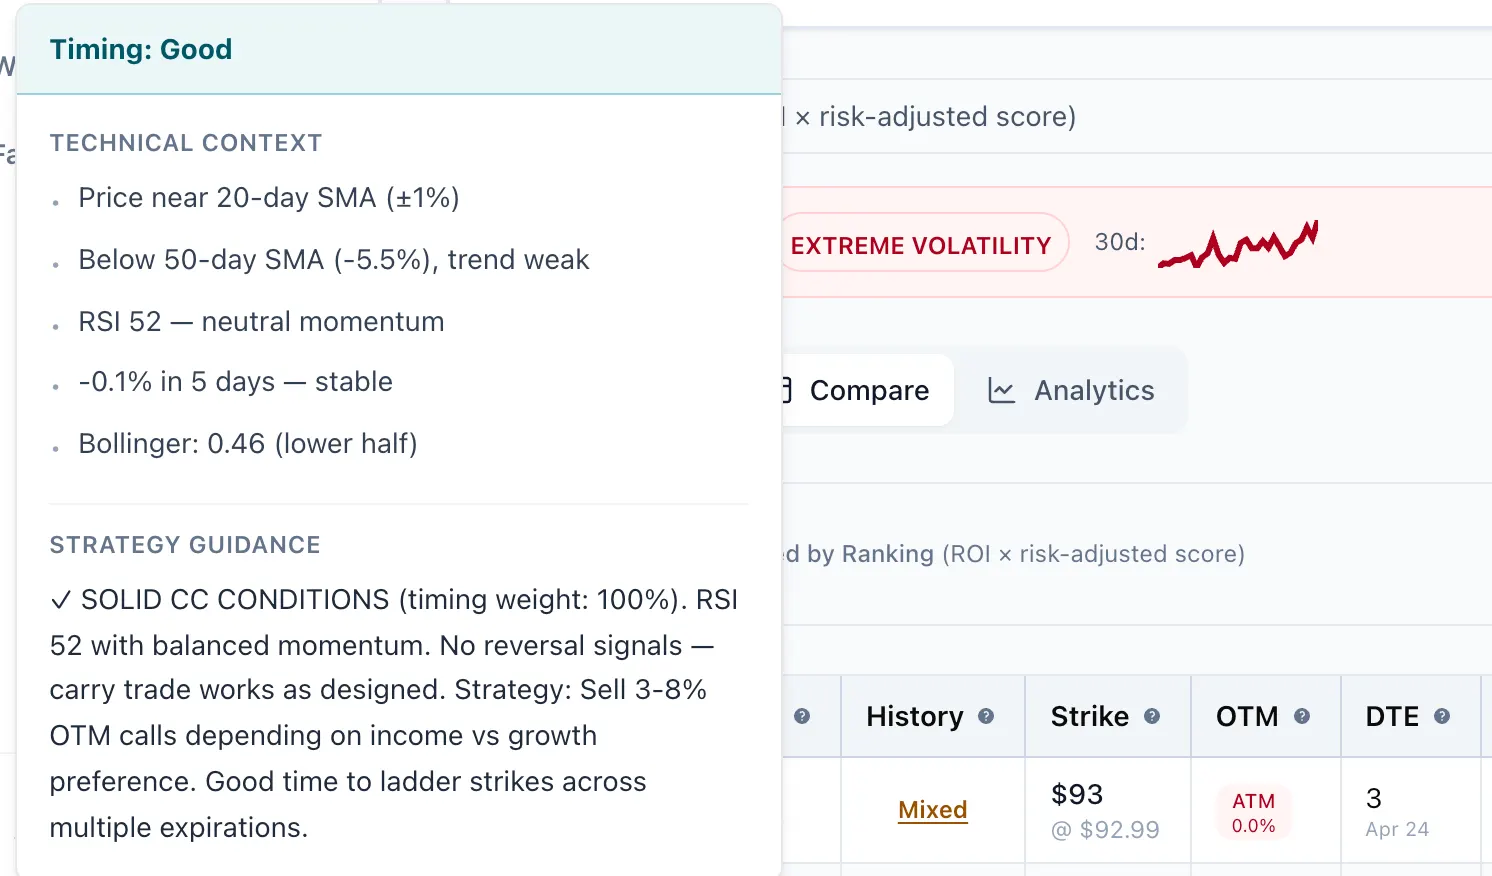
A technical-context panel that reads price action against the 20-day and 50-day moving averages, RSI momentum, and Bollinger Band position. It translates those signals into plain-English strategy guidance so you know whether current conditions favor entering a new position or waiting for a better setup.
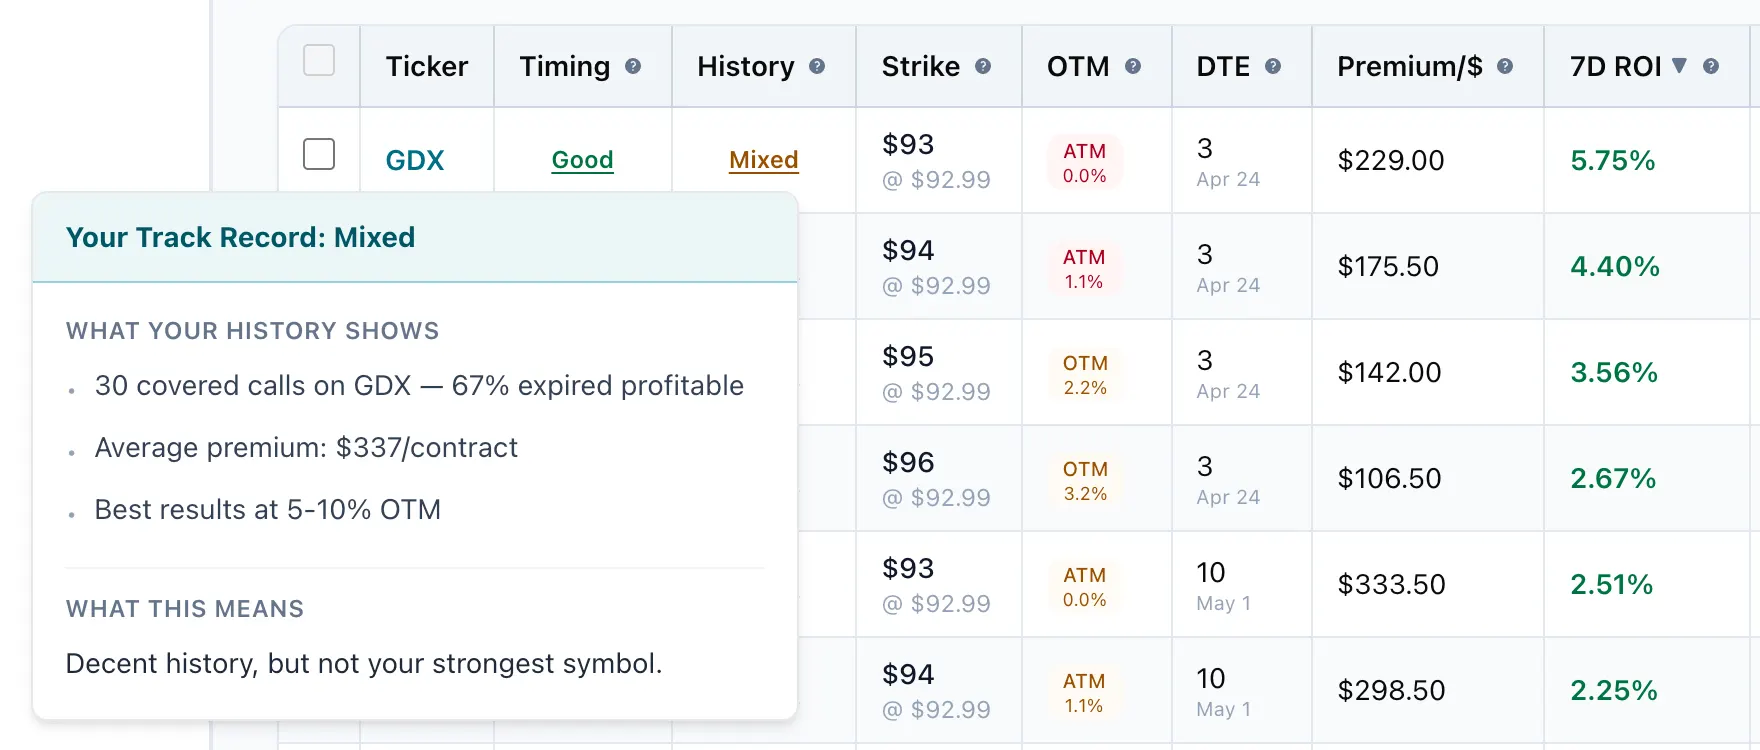
Looks back at your own portfolio history for the ticker you are analyzing. It shows whether you have traded that symbol before, how those trades performed, and whether your track-record suggests bullish or cautious bias for the next cycle.
Outcome: See which positions are expiring soon and what to do about them.
For sellers who want a weekly review system instead of ad-hoc spreadsheet checks.
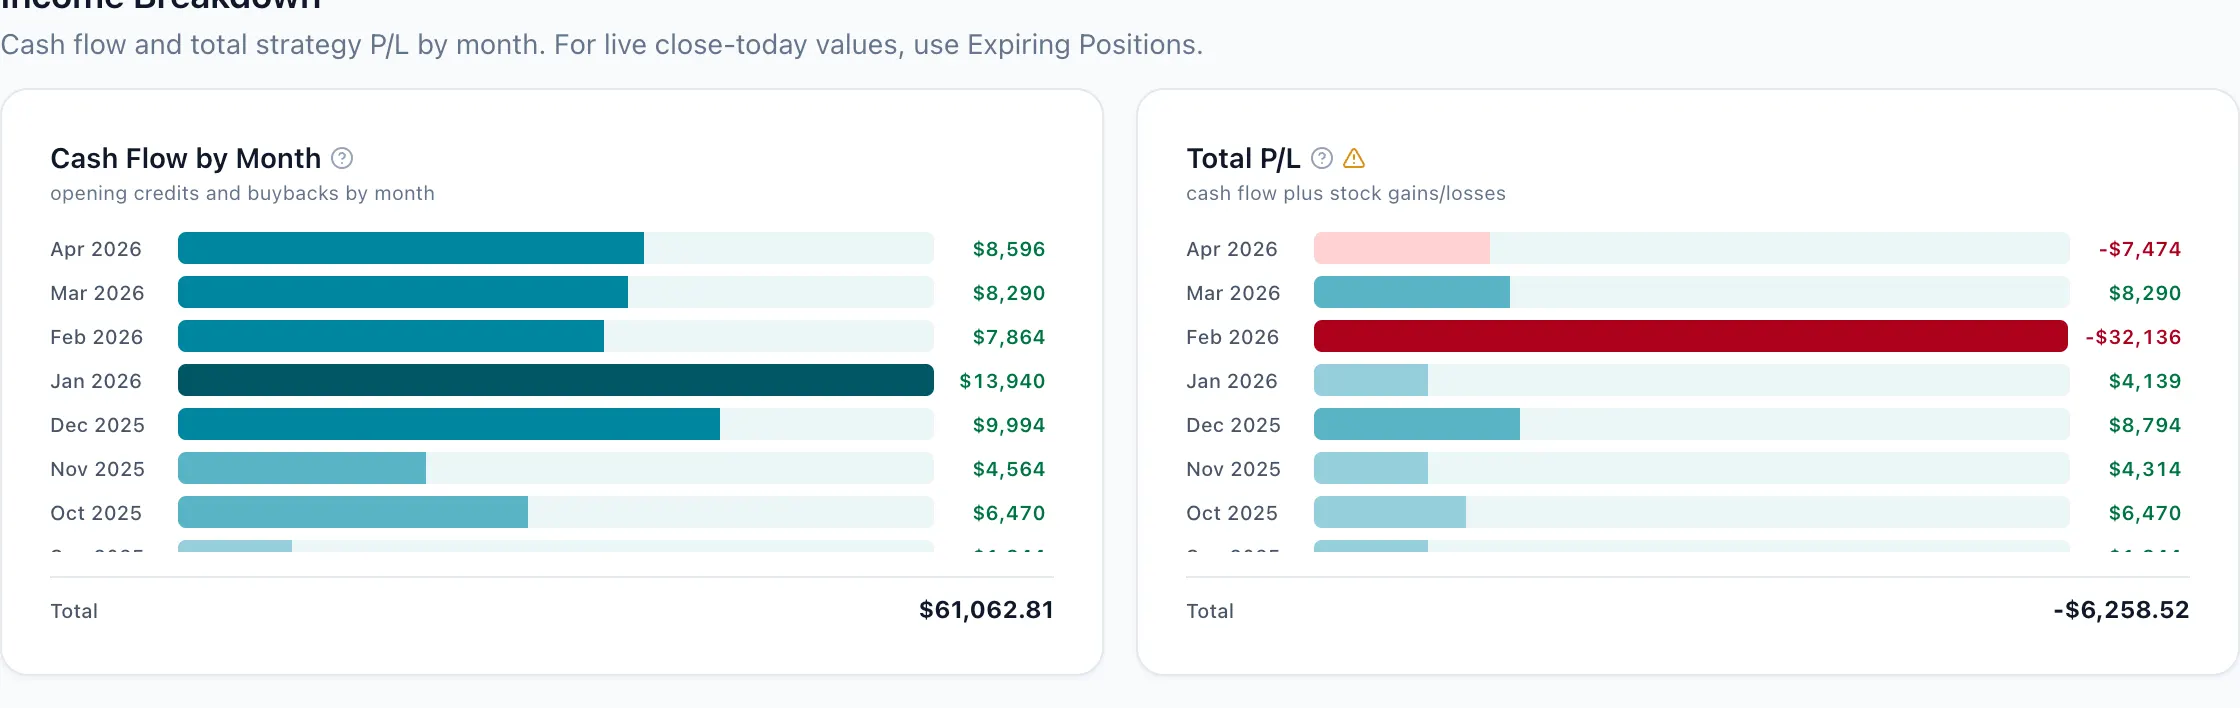
A dedicated income calendar that rolls up gains and losses across complete wheel cycles. See at a glance which months delivered the best risk-adjusted income and where drawdowns clustered.
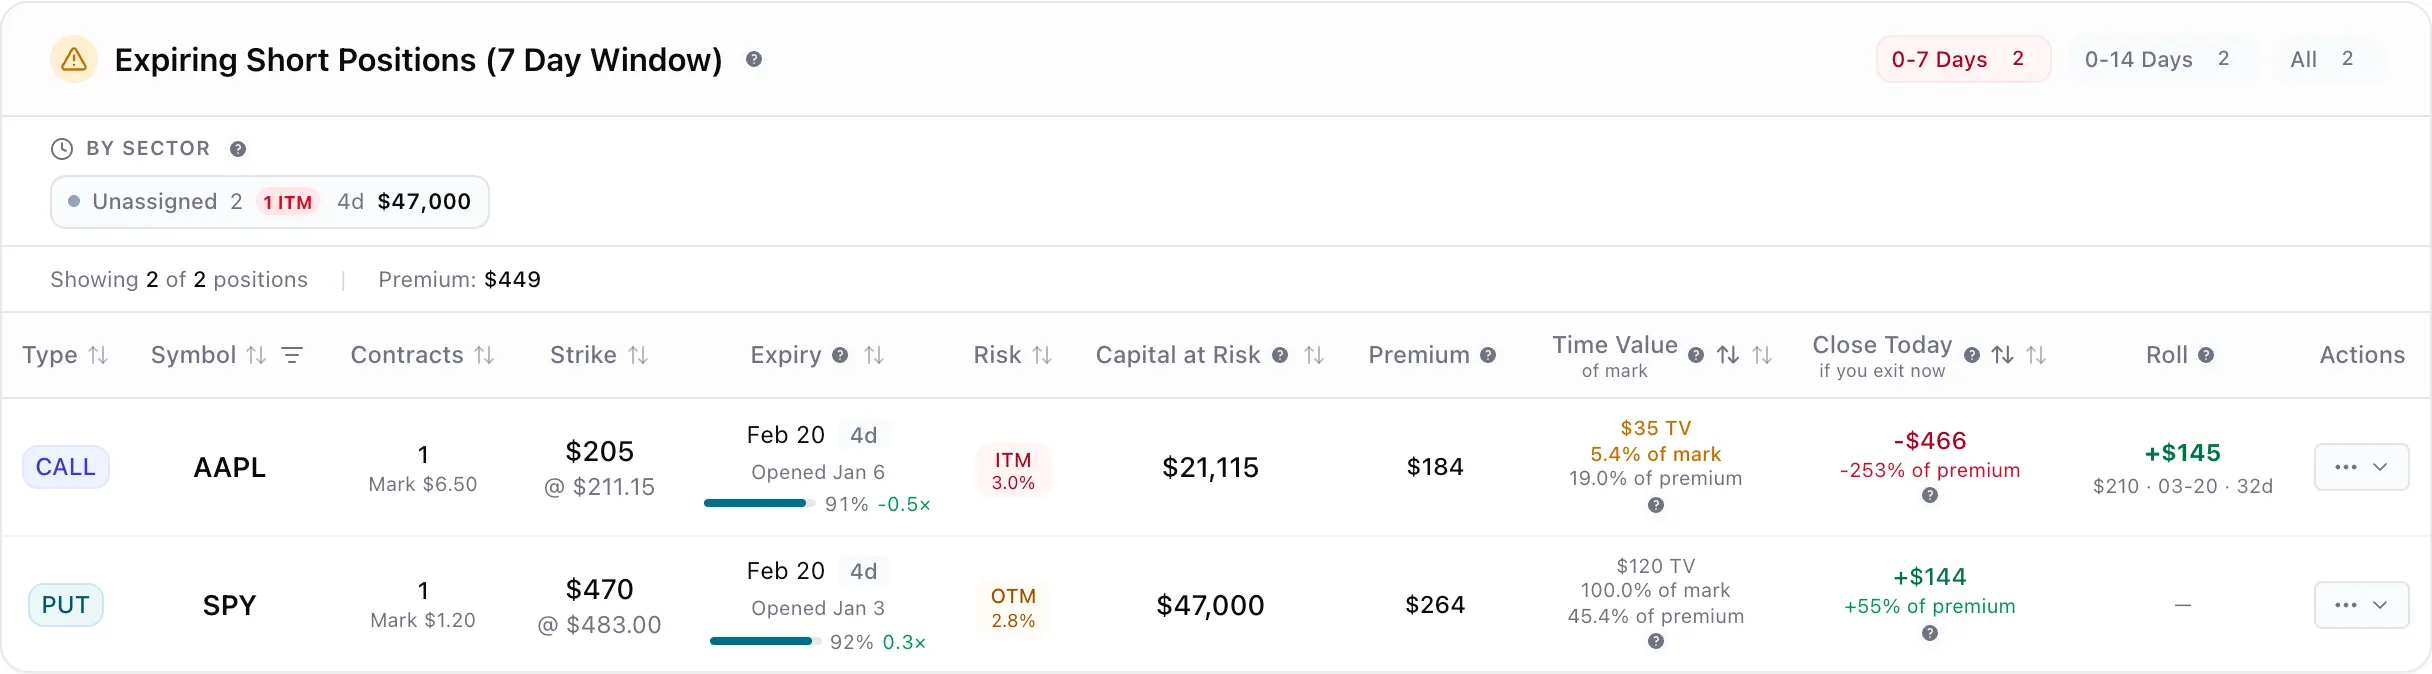
A focused view on positions expiring soon, complete with closing recommendations. Know exactly when to take profits, roll for credit, or let assignment run its course.
Outcome: Get notified only when a position actually needs attention.
For sellers who want alerts tied to DTE and assignment risk, not market noise.
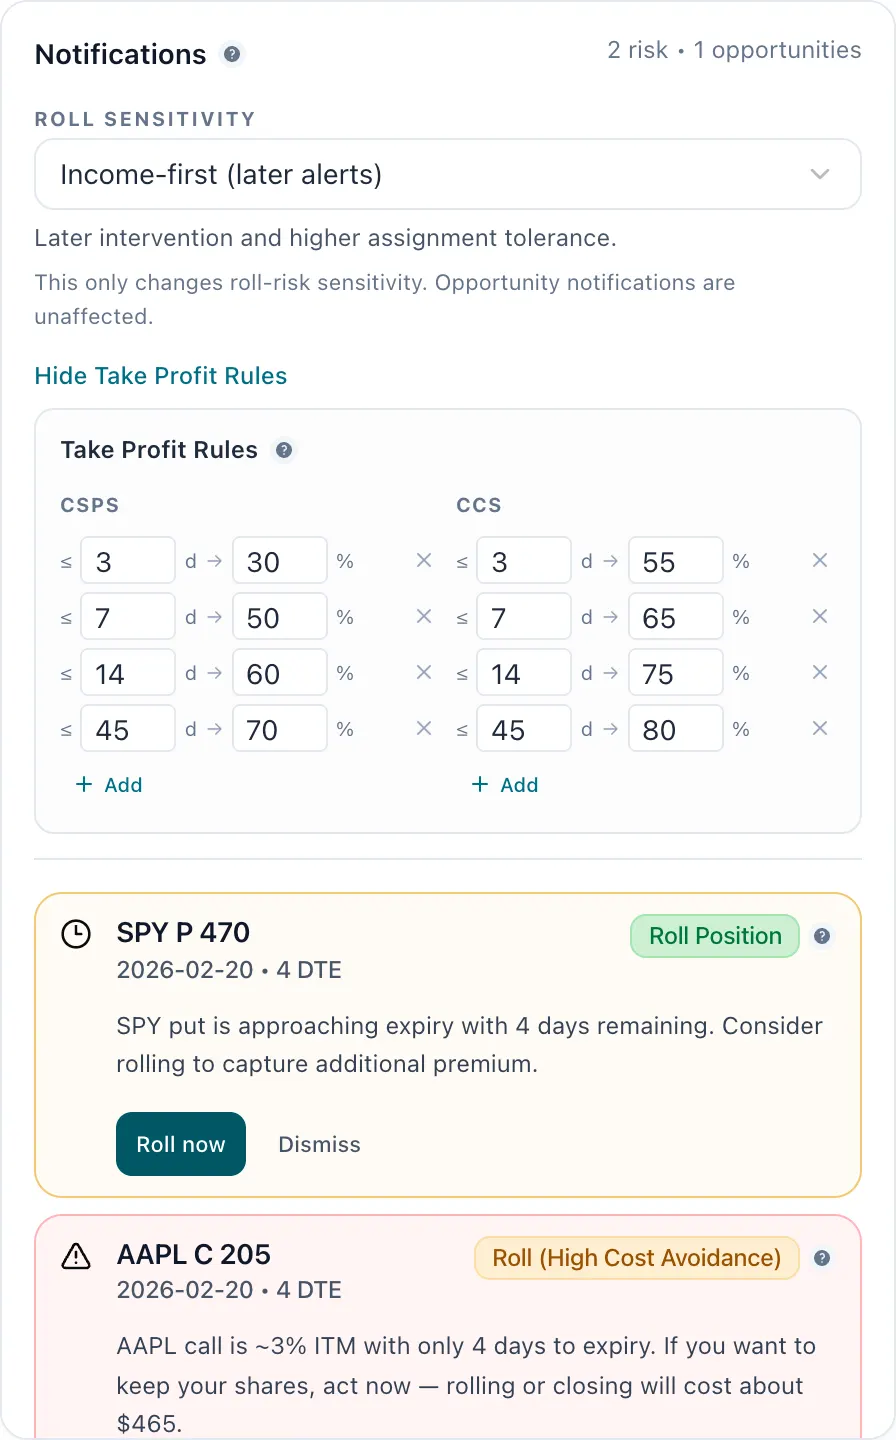
Outcome: Understand which strategies actually produce income and which just tie up capital.
For sellers who want data on premium capture, assignment rates, and cycle returns.
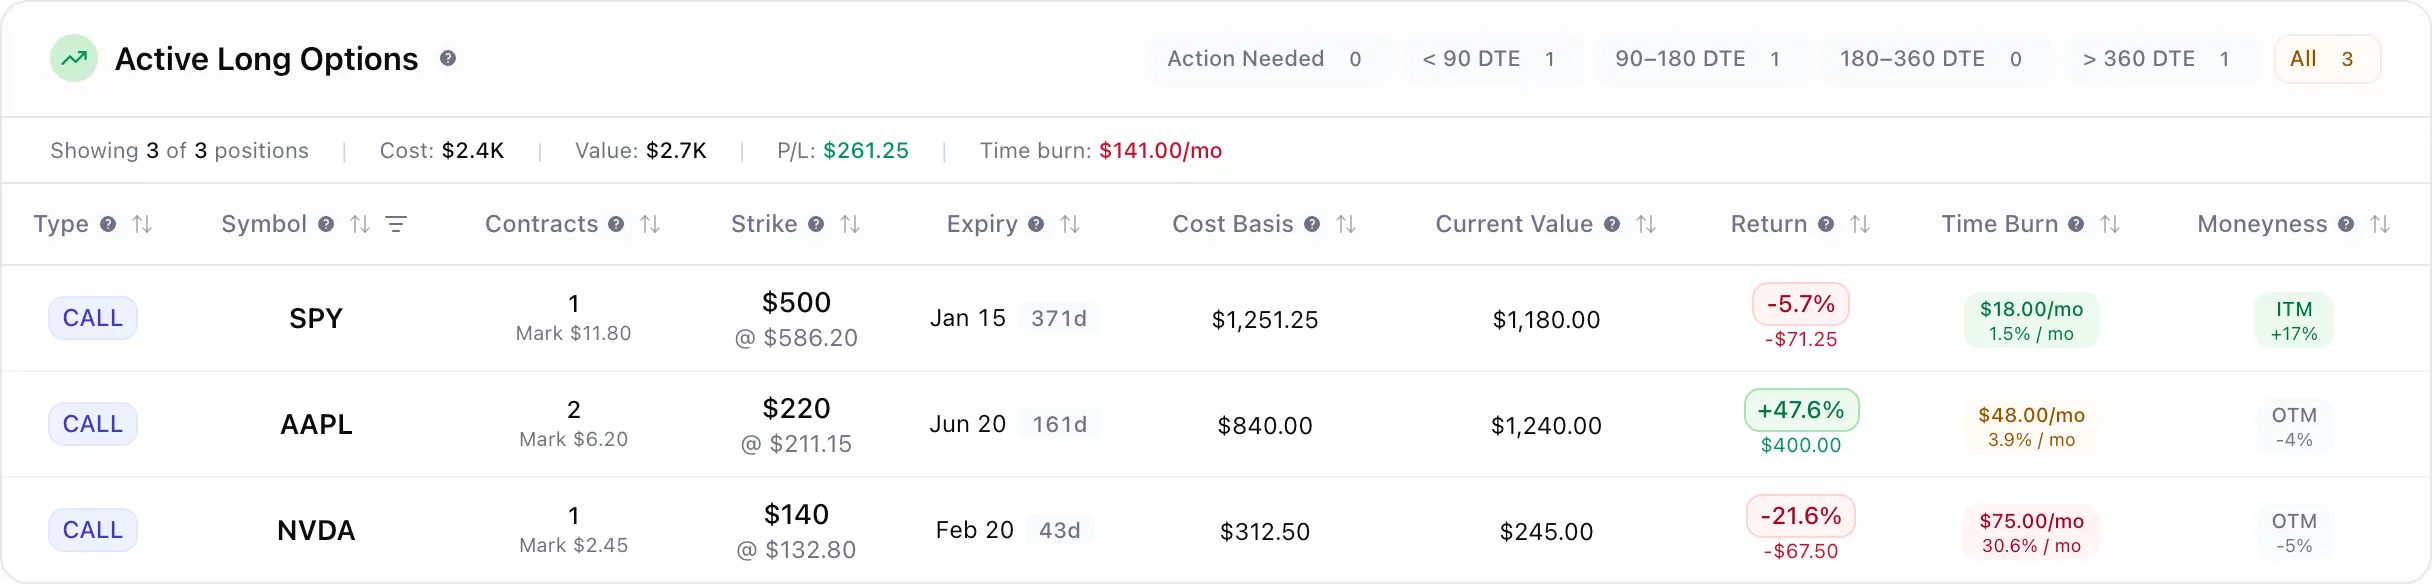
Dive into your long-call and long-put track records. See entry-to-exit P&L, holding-period returns, and win-rate by DTE bucket so you can refine directional strategies with real data.
A per-stock wheel cycle report that traces every leg from the initial cash-secured put through assignment, covered-call sales, and final exit. Understand total premium captured, cost-basis evolution, and annualized yield for every symbol you have wheeled.
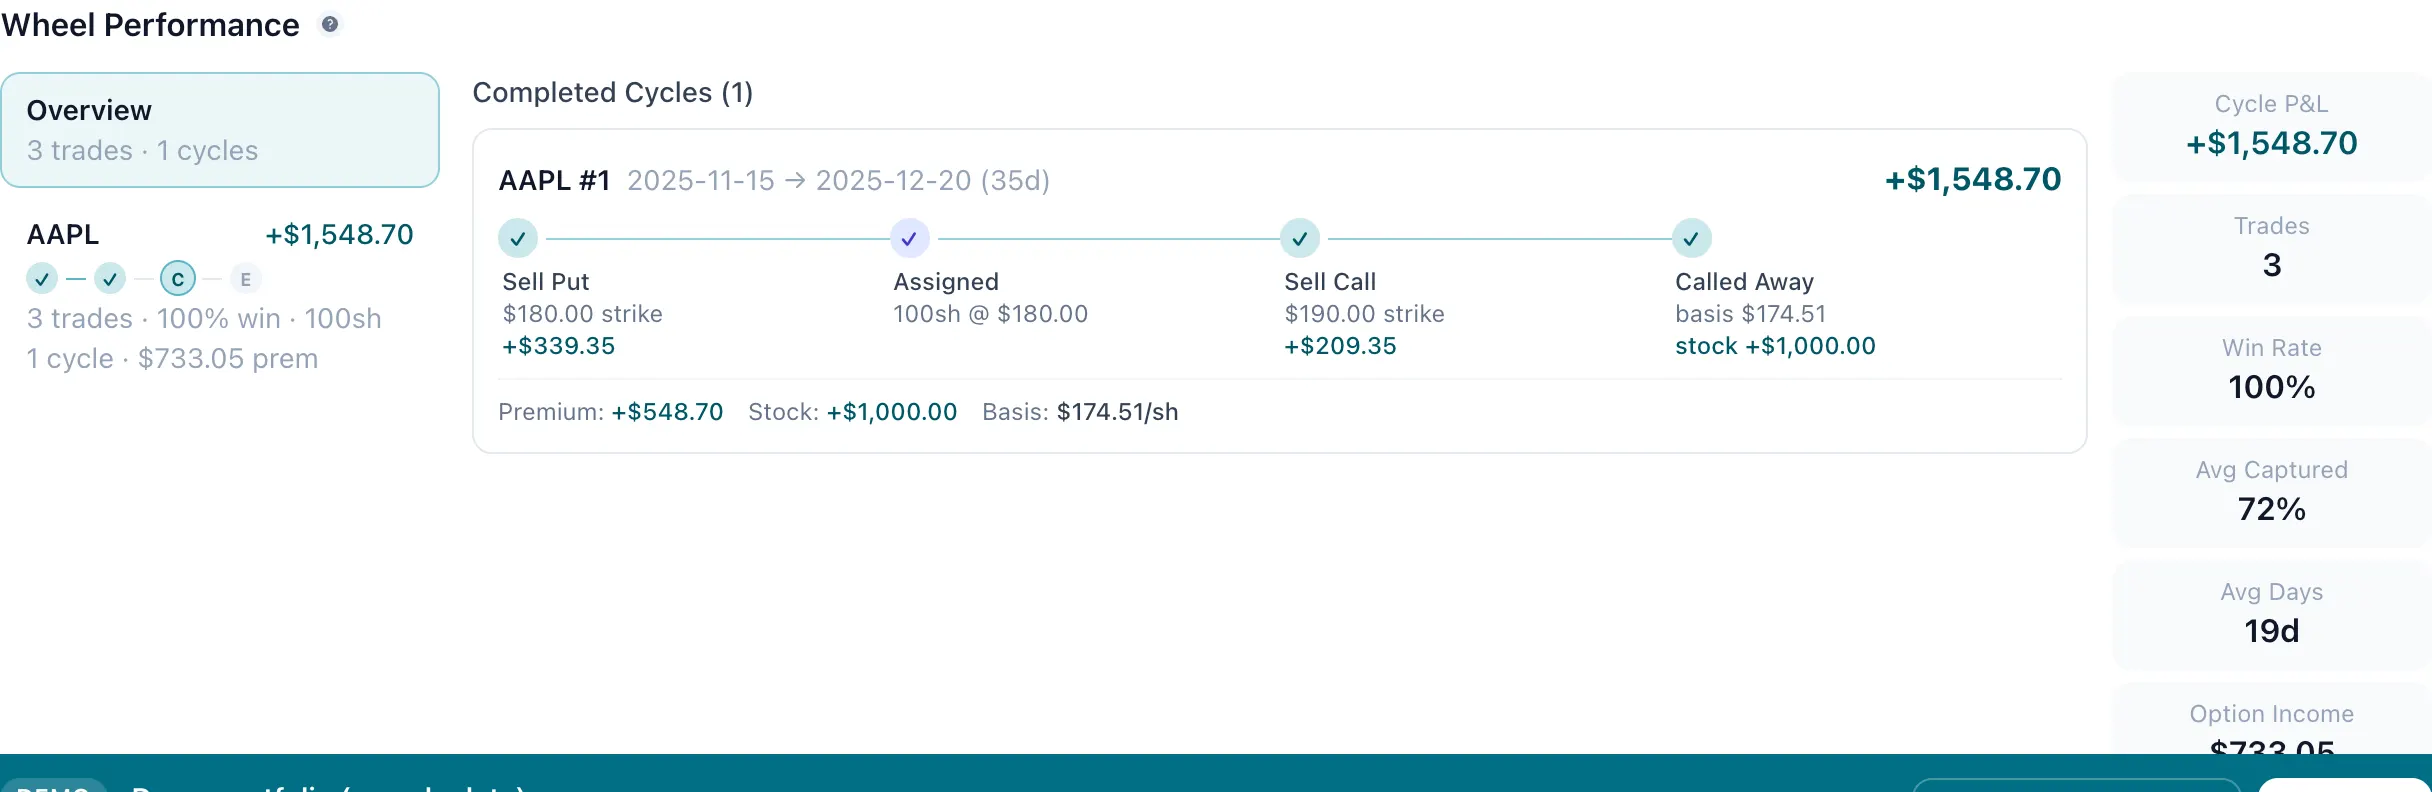
Log in to see the new indicators, analytics, and alerts applied to your own portfolio.
A quick walkthrough of the latest portfolio and strategy features