A call credit spread is an options strategy where you sell a call option at a lower strike price and buy a call option at a higher strike price on the same underlying stock with the same expiration date. This generates net premium income while capping both profit and risk.
Call credit spreads are a defined-risk options strategy where you sell a call option at a lower strike price and simultaneously buy a call option at a higher strike price on the same underlying stock, with both options sharing the same expiration date. You collect a net premium upfront—called the credit—and profit when the stock stays below your short strike at expiration.
This bearish-to-neutral approach lets you generate income when a stock stays flat or declines, making it ideal for income-focused traders who want capped risk. Unlike shorting stock (unlimited risk, margin requirements, dividend headaches) or buying puts (time decay works against you, need significant moves to profit), call credit spreads give you a mechanical way to profit from neutral-to-bearish outlooks with known risk.
Most income strategies force you to be bullish. Sell cash-secured puts, hope the stock doesn't drop. Sell covered calls, hope it doesn't rally too hard. The common thread? You need the market to cooperate with a long or neutral bias.
But markets don't always cooperate. Sometimes stocks run too far, too fast. Valuations stretch. Technical indicators scream overbought. And sitting on the sidelines means missing income opportunities.
Enter the call credit spread—also called the bear call spread. This strategy flips the script: you collect premium by betting a stock won't rise above a resistance level. Your profit is capped (the credit received), but more importantly, your loss is capped and defined upfront.
This makes them ideal for traders managing buying power requirements who want defined-risk exposure. For a deeper look at how defined-risk strategies fit into a complete options portfolio, see our options portfolio management guide.
Why Call Credit Spreads Matter in 2026
With equity markets reaching new highs and volatility compressed to historic lows, the ability to generate income from bearish or neutral positions has never been more valuable. Call credit spreads allow you to:
- Capture elevated premiums when stocks reach overbought conditions
- Hedge existing long positions without the cost of buying protective puts
- Profit from range-bound markets by combining with put credit spreads (iron condors)
- Trade in retirement accounts where naked short selling is prohibited
According to Cboe Global Markets data, credit spreads accounted for over 23% of all retail options trades in 2024, with call credit spreads growing 18% year-over-year as traders seek alternatives to traditional short-selling strategies [source: Cboe Options Institute, Retail Trading Trends Report, 2024].
This comprehensive guide covers everything from basic structure to advanced DTE optimization. You'll learn when call spreads beat put spreads, how to select strikes for maximum probability of profit, mechanical management rules for losing positions, how to combine call and put spreads into iron condors for range-bound markets, and the tax implications that can save you thousands. Whether you're new to options or looking to refine your bearish income strategy, this guide provides actionable frameworks backed by real market data.
Call Credit Spreads in Bearish Markets
According to the Options Industry Council (OIC), call credit spreads are particularly effective in overbought markets or when earnings volatility is expected to decline [source: OIC, Advanced Options Strategies Guide, 2024]. When combined with technical analysis tools available on platforms like Thinkorswim and TradingView, traders can identify optimal entry points for bearish spread positions.
Research from Tastytrade demonstrates that call credit spreads managed at 50% of max profit or 21 DTE (whichever comes first) show improved risk-adjusted returns compared to holding until expiration [source: Tastytrade Research, "Credit Spread Management Study," 2023]. This mechanical approach removes emotion from trade management.
What Makes This Guide Different
Most call credit spread tutorials stop at the basics—sell a call, buy a call, collect credit. This guide goes further. You'll find specific strike selection rules based on delta targets, DTE recommendations backed by historical backtests, platform-specific order entry instructions, and a real 2-month campaign showing actual P&L. We also cover the tax advantages of trading index options like SPX under Section 1256, which can reduce your tax bill by 30% compared to stock options.
From Theory to Practice: How Days to Expiry Implements Call Spread Logic
Reading about strike selection and DTE optimization is valuable, but the real edge comes from applying these frameworks to live market data. Here's how the Days to Expiry platform operationalizes the concepts in this guide:
Strike Selection Becomes Filterable Data
- The Strategy Analyzer displays delta, IV, and distance-to-strike for every available expiration
- Instead of guessing at 0.30 delta, you see exact probabilities and Greeks in real-time
- Compare multiple strike widths side-by-side to optimize risk/reward
DTE Framework Becomes a Screening Tool
- Filter opportunities by expiration range (14, 30, 45, 60 DTE)
- See theta decay curves and IV percentile at a glance
- Identify which expiration offers the best risk-adjusted premium
Management Rules Become Alerts
- Track open positions with automatic DTE countdown
- Set profit targets (50% of max profit) and loss limits (200% of credit)
- Portfolio-level view shows which spreads need attention
📚 Related Strategies: Learn about the put credit spread for bullish market outlooks, explore the bear call spread for detailed adjustment tactics, and see our data-driven analysis of the best DTE for credit spreads. For the complete vertical spread picture, read our vertical spread strategy guide. Also see our options Greeks guide to understand how delta, theta, and vega impact your spreads.
Find your next trade: Use our Strategy Analyzer to screen for high-probability call credit spread setups with real-time delta, IV, and premium data.
What is a Call Credit Spread?
A call credit spread (bear call spread) is a defined-risk options strategy where you simultaneously sell a call option at a lower strike price and buy a call option at a higher strike price, both with the same expiration date. You receive a net credit upfront, and you profit if the underlying stock stays below your short strike at expiration.
Think of it as insurance for bearish traders: you cap your maximum loss in exchange for capping your maximum gain.
The Two-Leg Structure
Leg 1 (Short Call): Sell a call at strike A (closer to current price)
- This is where you collect most of the premium
- You're betting the stock stays below this strike
- Higher risk, higher reward component
Leg 2 (Long Call): Buy a call at strike B (further from current price)
- This defines your maximum loss
- Acts as insurance against unlimited upside risk
- Costs less than the short call, creating net credit
 Assignment mechanics and execution process showing decision pathways
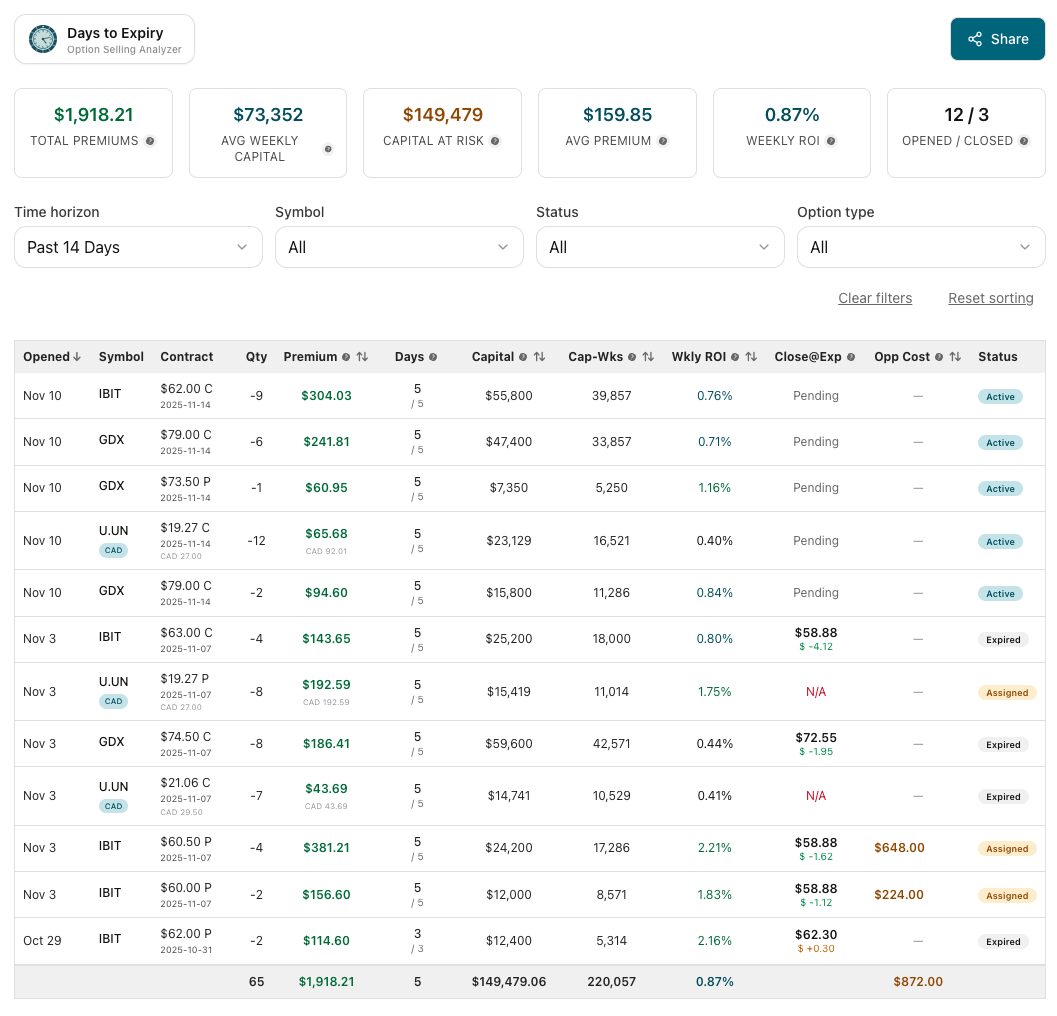
View position management in Portfolio View →
Real Example Walkthrough
Scenario: XYZ stock trading at $100. You expect it to stay below $105 over the next month.
Trade Setup:
| Leg | Strike | Action | Price | Delta |
|---|---|---|---|---|
| Short Call | $105 | Sell | +$1.50 | 0.30 |
| Long Call | $110 | Buy | -$0.50 | 0.15 |
| Net Credit | $1.00 |
Position Metrics:
- Maximum Profit: $100 per contract (the credit received)
- Maximum Loss: $400 per contract (width minus credit: $5.00 - $1.00)
- Breakeven: $106 (short strike + credit received)
- Probability of Profit: ~70% (based on 0.30 delta)
Return on Capital: 25% ($100 profit / $400 risk)
When You're Right
The stock stays below your short strike ($105). Both calls expire worthless. You keep the $100 credit.
Return on capital: $100 profit / $400 collateral = 25% return
Why Traders Choose Call Credit Spreads Over Naked Calls
Some traders sell naked calls to collect more premium, but this introduces unlimited upside risk. A naked call on a $100 stock might collect $150 in premium, but if the stock rallies to $200, the loss is $9,850 per contract. Call credit spreads cap that loss at a known amount—$400 in the example above—while still providing meaningful income. This defined-risk structure is why call credit spreads are permitted in IRA accounts where naked selling is prohibited, and why they require significantly less buying power.
When You're Wrong
The stock rallies above $110. You lose the full width minus credit = $400. But you knew this risk upfront—no surprises, no margin calls, no unlimited loss.
Call Credit Spread vs Put Credit Spread: Which to Use?
Both spreads work the same mechanically—you're selling premium with defined risk. The difference is directional bias.
Use Call Credit Spreads When:
1. You're bearish or neutral-to-bearish
- Stock has rallied too far, too fast
- Valuation looks stretched (high P/E, overbought technicals)
- Resistance level overhead that you don't think will break
Example: Stock rallied from $80 to $100 in 3 weeks. RSI = 78 (overbought). You think it'll consolidate or pull back. Sell $105/$110 call spread.
2. The stock is at resistance
- Stock has hit $105 three times in the past 6 months and pulled back each time
- You're betting it fails to break through again
3. Implied volatility is elevated and you expect IV crush
- Stock about to report earnings. IV is sky-high. You think earnings will be a "sell the news" event.
- Sell call spreads right before earnings, profit from IV crush + stock pullback
4. You want to bet against a specific price level without shorting
- Shorting stock = unlimited loss, margin requirements, dividend risk
- Call spread = defined loss, lower capital requirement, no dividend risk
Use Put Credit Spreads When:
1. You're bullish or neutral-to-bullish
- Stock pulled back to support
- You think it won't drop further
2. You want to own the stock eventually
- Put spreads don't lead to assignment (both legs cancel out)
- But they're still a bullish bet with defined risk
3. The stock is at support
- Stock has bounced off $95 multiple times
- You bet it holds again
4. You're building a balanced portfolio
- Combine put spreads for bullish exposure with call spreads for bearish exposure
- Creates an iron condor in range-bound markets
- See our options risk management guide for position sizing rules
Example Comparison
Scenario: Stock at $100. You're analyzing both sides.
| Spread Type | Strikes | Credit | Max Loss | Directional Bias | When to Use |
|---|---|---|---|---|---|
| Put Credit | Sell $95 / Buy $90 | $1.00 | $400 | Bullish | Stock at support, expect bounce |
| Call Credit | Sell $105 / Buy $110 | $1.00 | $400 | Bearish | Stock at resistance, expect pullback |
Same risk/reward profile. Opposite direction. Pick based on your market view.
How to Structure a Call Credit Spread
Building a call spread involves the same three decisions as put spreads: strike selection, width, and DTE.
Step 1: Choose Your Short Strike (The Sold Call)
This is where you're betting the stock won't go. It determines your probability of profit.
Guidelines:
- Conservative: 0.20-0.25 delta (15-20% probability stock finishes above this strike)
- Moderate: 0.30-0.35 delta (30-35% probability)
- Aggressive: 0.40-0.45 delta (40-45% probability)
Example (stock at $100):
- Conservative: Sell $108 call (0.20 delta) = 80% chance of profit
- Moderate: Sell $105 call (0.30 delta) = 70% chance of profit
- Aggressive: Sell $103 call (0.40 delta) = 60% chance of profit
The closer to current price, the more premium you collect—but the higher your assignment risk.
Most traders use 0.30 delta as the sweet spot.
Step 2: Choose Your Long Strike (The Bought Call)
This defines your maximum loss. The further away, the wider the spread, the more capital at risk.
Common widths:
- $5 wide: Standard for most stocks
- $10 wide: For expensive stocks (> $200)
- $2-3 wide: For cheap stocks (< $50)
Rule of thumb: Keep width ≤ 10% of stock price.
Example (stock at $100):
- Narrow: Sell $105, Buy $108 ($3 wide) = collect $0.60, risk $2.40
- Standard: Sell $105, Buy $110 ($5 wide) = collect $1.00, risk $4.00
- Wide: Sell $105, Buy $115 ($10 wide) = collect $1.80, risk $8.20
Narrower spreads have higher ROI but collect less absolute premium.
Step 3: Choose Your DTE
Same DTE principles as put spreads apply here. Let's optimize for call spreads specifically.
DTE Optimization for Call Credit Spreads
Short DTE (7-14 Days): Quick Bearish Plays
Why use it:
- Fast directional bet on a pullback
- High probability if stock is overbought
- Can capitalize on post-earnings IV crush
Setup:
- 10 DTE, sell 0.25 delta call (far OTM)
- $5 wide spread
- Collect $0.30-0.50
Example:
- Stock at $100 after rallying 15% in 2 weeks
- Sell $107 call / Buy $112 call (10 DTE)
- Collect $0.35 ($35)
- Risk $4.65 ($465)
- Return: 7.5% in 10 days if stock stays below $107
Advantages:
- Quick turnover
- Can time entries around technical resistance levels
- Lower gamma risk than long DTE near expiration
Disadvantages:
- Small premium per trade
- If stock has momentum, it can easily breach your strike
- More frequent management
Best for: Tactical bearish plays on overbought stocks or post-earnings fades.
Medium DTE (21-35 Days): Standard Bearish Income
Why use it:
- Best balance of premium and probability
- Capture peak theta decay
- Time for stock to consolidate or pull back
Setup:
- 30 DTE, sell 0.30 delta call
- $5 wide spread
- Collect $0.80-1.20
Example:
- Stock at $100, sitting at technical resistance
- Sell $105 call / Buy $110 call (30 DTE)
- Collect $1.00 ($100)
- Risk $4.00 ($400)
- Return: 25% in 30 days if stock stays below $105
Advantages:
- Meaningful premium collection
- More time for bearish thesis to play out
- Less management overhead
Disadvantages:
- Capital locked up for a month
- If stock breaks out strongly, harder to defend
Best for: Most traders. Default DTE for consistent bearish income.
Monthly Income Calculator
Estimate income from selling covered calls or cash-secured puts
Estimates based on simplified Black-Scholes. Actual premiums depend on live market conditions, liquidity, and bid-ask spreads. Verify in Strategy Analyzer.
Long DTE (45-60 Days): Patient Bearish Thesis
Why use it:
- Maximum premium upfront
- Most forgiving (stock can rally temporarily and still work out)
- Can close early at 50% profit
Setup:
- 60 DTE, sell 0.30-0.35 delta call
- $10 wide spread
- Collect $2.00-3.00
Example:
- Stock at $100 after extended rally
- Sell $105 call / Buy $115 call (60 DTE)
- Collect $2.50 ($250)
- Risk $7.50 ($750)
- Return: 33% over 60 days, or close early at 50% profit
Advantages:
- Big credit upfront
- Time for consolidation or reversal
- Can withstand temporary rallies
Disadvantages:
- Higher vega exposure (vulnerable to IV spikes if stock rallies)
- Capital tied up longer
- Slower theta decay initially
Best for: Longer-term bearish views or stocks in clear downtrends.
DTE Recommendation Summary
| DTE Range | Best For | Credit Target | Management Style |
|---|---|---|---|
| 7-14 days | Post-earnings IV crush, overbought bounces | $0.30-$0.50 | Active monitoring |
| 21-35 days | Standard bearish income | $0.80-$1.20 | Weekly check-ins |
| 45-60 days | Longer-term thesis, volatile stocks | $2.00-$3.00 | Set GTC orders |
Start with 30 DTE for call spreads, just like put spreads. It's the sweet spot for theta capture and probability of profit.
As you gain experience, mix strategies: 14 DTE for quick tactical plays, 45 DTE for higher-conviction bearish views.
Pro Tip: Call spreads benefit from IV crush more than put spreads because rising markets often coincide with falling volatility. Time your entries after volatility spikes for better credits.
Tax Implications of Call Credit Spreads
Understanding the tax treatment of call credit spreads helps you plan your strategy more effectively. The tax consequences differ based on how the trade closes and what underlying you're trading.
Tax Treatment by Outcome
Expiration (Maximum Profit)
- Both legs expire worthless
- The entire credit received is treated as short-term capital gain
- Taxed at your ordinary income rate
- Reported in the year the options expire
Expiration (Maximum Loss)
- Both legs expire in-the-money
- The loss equals the spread width minus the credit received
- Short-term capital loss (can offset other gains)
Early Close (Partial Profit/Loss)
- Buy back the spread before expiration
- Gain/loss = credit received minus debit paid to close
- Short-term capital gain or loss
Index Options (SPX, NDX, RUT) - Section 1256 Advantage
Trading call credit spreads on broad-based index options like SPX, NDX, or RUT offers significant tax advantages under Section 1256 of the Internal Revenue Code:
- 60% of gains taxed at long-term capital gains rates (0%, 15%, or 20%)
- 40% of gains taxed at short-term rates (ordinary income)
- Mark-to-market accounting at year-end (realized and unrealized gains/losses)
- No wash sale rules apply
Example Tax Comparison:
| Scenario | Stock Options (Short-Term) | SPX Options (Section 1256) |
|---|---|---|
| $10,000 profit | $3,200 tax (32% bracket) | $2,240 tax (blended rate) |
| Tax savings | — | $960 (30% less) |
Tax Planning: If you're in a high tax bracket, consider focusing your call credit spread trades on Section 1256 index products like SPX instead of individual stocks. Learn more about SPX vs SPY options to understand the trade-offs.
Wash Sale Considerations
Unlike stock trades, options wash sale rules are complex. If you close a call credit spread at a loss and enter a "substantially identical" position within 30 days, the wash sale rule may defer your loss.
Safe practices:
- Wait 31 days before re-entering the same strikes on the same underlying
- Trade different strikes or expirations if you want immediate re-entry
- Consider index options (Section 1256) where wash sales don't apply
Related: See our complete options tax guide for detailed reporting requirements and strategies.
Selecting Stocks for Call Credit Spreads
Not every stock is a good call spread candidate. You want specific setups:
Setup 1: Overbought After Strong Rally
What to look for:
- Stock up 10-20%+ in 1-3 weeks
- RSI > 70 (overbought)
- Trading at or near all-time highs with no clear catalyst
Why it works: Mean reversion. Stocks that rally hard tend to consolidate or pull back.
Example:
- Stock rallied from $80 to $100 in 2 weeks after earnings beat
- RSI = 75
- No major news ahead
- Sell $105/$110 call spread (30 DTE)
- Bet: Stock consolidates below $105 for next month
- Monitor for gamma risk near expiration as DTE decreases
Setup 2: Failed Breakout
What to look for:
- Stock attempted to break resistance multiple times
- Each time, it failed and pulled back
- Volume declining on recent rally attempts
Why it works: Resistance levels are real. If a stock can't break through after 3-4 attempts, it's likely to fail again.
Example:
- Stock has hit $105 four times in past 6 months
- Each time, it reversed back to $95-100 range
- Currently at $102
- Sell $105/$110 call spread
- Bet: Fifth attempt fails too
Setup 3: Post-Earnings IV Crush (Bearish Variant)
What to look for:
- Stock has earnings in 1-2 days
- IV is elevated (60-80th percentile)
- You're bearish on the results or think good news is priced in
Why it works: Even if stock doesn't drop much, IV crush after earnings will collapse call premium.
Example:
- Stock at $100, earnings tomorrow
- IV = 65%
- Sell $105/$110 call spread (7 DTE, expires day after earnings)
- Even if stock goes to $103, IV drops from 65% to 35%, your spread profits from IV crush
Risk: If earnings are a blowout and stock gaps up 10%, you take max loss. Only do this if you have a strong bearish view.
Setup 4: Overvalued High-Flyers
What to look for:
- Stock trading at nosebleed valuations (P/E > 50, no earnings, meme stock)
- Parabolic chart (up 100%+ in 3 months)
- Reddit/social media hype reaching peak
Why it works: Gravity eventually wins. High-flyers crash hard when sentiment shifts.
Example:
- Meme stock at $150, up 200% in 2 months
- No fundamental justification
- Sell $160/$170 call spread (45 DTE)
- Bet: Momentum fades, stock consolidates or drops
Risk: Momentum can last longer than you expect. Only allocate 5-10% of portfolio to these "fade the hype" plays.
Executing Call Credit Spreads: Platform Guide
The mechanics of entering and managing call credit spreads vary by broker. Understanding your platform's specific features can improve your execution and reduce costs.
Order Entry Best Practices
Always Use Spread Orders
- Enter the entire spread as one order (not leg-by-leg)
- Prevents partial fills and legging risk
- Most brokers offer "Vertical Spread" or "Credit Spread" order types
Pricing Your Entry
- Start at the mid-price between bid and ask
- If not filled in 30 seconds, adjust by $0.01-0.02 toward the ask
- Never pay more than 10% away from mid-price in liquid options
Time of Day Matters
- Best liquidity: First 30 minutes after market open, last 30 minutes before close
- Avoid: First 5 minutes (wider spreads), midday (lower volume)
- Earnings plays: Enter 1-2 days before, not day-of (extreme IV expansion)
Platform-Specific Features
Interactive Brokers (IBKR)
- Use "Combo" order type for spreads
- Access to portfolio margin (lower capital requirements for qualified accounts)
- Real-time Greeks and scenario analysis in Risk Navigator
- IBKR Flex Query integration for automated P&L tracking
Thinkorswim (TD Ameritrade/Schwab)
- "Trade" tab → "All Products" → Right-click option chain → "Sell" → "Vertical"
- Analyze tab shows max profit/loss graphically before entry
- PaperMoney simulator for practice
- See our Thinkorswim walkthrough guide for detailed navigation
Tastytrade
- Built specifically for options traders
- Natural language order entry ("Sell the 105/110 call spread")
- Automatic position sizing based on account risk parameters
- Best-in-class portfolio visualization for spread management
Robinhood/Webull (Mobile-First)
- Tap option → "Select" multiple strikes → "Spread"
- Limited advanced features but sufficient for basic spreads
- Watch for assignment risk notifications (no phone support for urgent issues)
Understanding Buying Power Impact
Call credit spreads reduce your available buying power by the maximum loss amount:
Example:
- Sell $105/$110 call spread, collect $1.00 credit
- Max loss = $5.00 width - $1.00 credit = $4.00 ($400 per contract)
- Buying power reduction: $400 per contract
Portfolio Margin vs Reg-T:
- Reg-T: Fixed $400 reduction per spread
- Portfolio Margin: Dynamic based on overall portfolio risk (often 30-50% less)
Capital Planning: Use our options buying power guide to understand capital requirements across different strategies.
Managing Call Credit Spreads
Scenario 1: Stock Stays Below Short Strike (Winning Trade)
Example: Sold $105/$110 call spread. Stock at $102 with 7 days left.
Your options:
Option A: Hold to expiration
- Let both calls expire worthless
- Collect full credit
- Risk: If stock gaps up on news, you could still lose
Option B: Close at 50-70% profit
- Spread now worth $0.30 (you sold for $1.00)
- Close for $0.70 profit, redeploy capital
- Smart move if you've captured 70% of profit in 50% of time
Best practice: Close at 50% profit if it happens in < 21 days. Don't grind for the last 30%.
Scenario 2: Stock Rallies Above Short Strike (Losing Trade)
Example: Sold $105/$110 call spread. Stock rallied to $107 with 10 days left.
Your options:
Option A: Hold and hope for pullback
- Stock could reverse below $105
- But if it doesn't, you're taking max loss
Option B: Close early for partial loss
- Spread now worth $2.50 (you sold for $1.00)
- Down $1.50 = $150 loss
- Cut the loss, move on
Option C: Roll up and out
- Close $105/$110 spread (take the loss)
- Open new $110/$115 spread (30 DTE) for $1.20 credit
- Gives you more room and time
- Caution: Only if you still believe stock will stall
Best practice: Use the 50% loss rule. If spread is down 50% of max loss, close it. Don't hope for miracles.
Scenario 3: Stock Rallies Hard (Max Loss Territory)
Example: Sold $105/$110 call spread. Stock gapped to $115 on blowout earnings.
Your spread is worth $5.00 (max loss). You're down $400.
Your only option: Accept the loss.
Close the spread. Take the $400 hit. Move on.
Don't: Roll it into an even higher strike hoping for a reversal. That's how accounts blow up.
Learn: What went wrong? Did you sell into a catalyst (earnings)? Was the stock stronger than you thought? Adjust your strategy for next time.
Backtesting Call Credit Spreads: What the Data Shows
Historical backtests reveal important patterns about call credit spread performance that can inform your strategy selection.
Key Findings from Historical Studies
Tastytrade Research (2012-2023)
- 30 DTE, 0.30 delta call spreads managed at 50% profit showed:
- Win rate: 68-72% (varies by market regime)
- Average holding period: 14-18 days
- Risk-adjusted returns: Superior to holding until expiration
CBOE S&P 500 Iron Condor Index (CNDR)
- Combines call and put credit spreads on SPX
- 1-month, 5% out-of-the-money spreads
- Annualized return: ~4-6% with significantly lower volatility than buy-and-hold
Performance by Market Regime
| Market Condition | Call Spread Win Rate | Optimal DTE | Notes |
|---|---|---|---|
| Bull market | 55-60% | 14-21 DTE | Shorter duration reduces time for rallies |
| Bear market | 75-80% | 30-45 DTE | Higher IV, better credits, directional tailwind |
| Range-bound | 70-75% | 30 DTE | Sweet spot for theta decay capture |
| High volatility | 65-70% | 45-60 DTE | Wider strikes, more premium buffer |
The 21 DTE Rule for Call Spreads
Research consistently shows that closing credit spreads at 21 DTE (regardless of profit level) improves risk-adjusted returns:
- Why it works: Gamma risk accelerates in the final 3 weeks
- Trade-off: You leave some premium on the table, but avoid large losses from late-stage moves
- Implementation: Set calendar reminders or use platform alerts at 21 DTE
Related: Read our detailed analysis of the 21 DTE rule for the mechanics behind early closure.
Building Your Own Backtest Framework
To validate call credit spread strategies for your specific criteria:
- Define parameters: Underlying, DTE, delta, spread width, management rules
- Select timeframe: Minimum 2 years including different market conditions
- Track metrics: Win rate, average profit/loss, max drawdown, Sharpe ratio
- Paper trade: 3 months minimum before deploying capital
- Iterate: Adjust parameters based on results
Tools: Our options backtesting guide covers platforms and methodologies for testing strategies historically.
Call Credit Spreads vs Naked Call Selling: Why Spreads Win
Some traders sell naked calls to collect more premium. Bad idea for most retail traders.
Naked Call Selling
Structure: Sell $105 call on $100 stock, collect $1.50
Pros:
- Collect full premium ($150 vs $100 for spread)
- No long leg to pay for
Cons:
- Unlimited loss potential (if stock goes to $200, you lose $9,500)
- Massive margin requirements (broker requires 20-30% of stock value as collateral)
- Assignment risk (you'll be short shares if exercised)
- Not allowed in IRA accounts (most brokers)
Call Credit Spread
Structure: Sell $105 call, buy $110 call, collect $1.00
Pros:
- Defined max loss ($400, known upfront)
- Lower margin requirements ($400 vs $2,000-3,000 for naked)
- Allowed in IRA accounts
- No short stock assignment (both legs offset)
Cons:
- Collect less premium ($100 vs $150)
Verdict: For 99% of traders, spreads are the better choice. The reduced premium is a small price to pay for capped risk and lower capital requirements.
Only sell naked calls if:
- You have a margin account with $100k+
- You're comfortable with unlimited loss potential
- You're hedging an existing long position (covered calls)
Combining Call and Put Spreads: Iron Condors
Once you understand both call and put credit spreads, the natural progression is combining them: the iron condor.
Structure:
- Sell put spread below current price (bullish side)
- Sell call spread above current price (bearish side)
- Collect credit on both
Example (stock at $100):
- Sell $95/$90 put spread for $1.00
- Sell $105/$110 call spread for $1.00
- Total credit: $2.00 ($200)
- Max loss: $5 (width) - $2 (credit) = $3 per side = $300 total
Your bet: Stock stays between $95 and $105 for the next 30 days.
Why it works:
- You're collecting premium on both sides
- In range-bound markets, both spreads expire worthless
- Return: $200 / $300 risk = 66% if stock stays in range
When to use:
- Low volatility environments (VIX < 20)
- Stock has been range-bound for weeks
- After a big move (rally or selloff) when you expect consolidation
Risk:
- If stock breaks out in either direction, one side loses
- Max loss is limited to one side (the other side is profitable)
We'll cover iron condors in detail in a future guide, but this is the natural evolution of credit spreads.
Real-World Example: 2-Month Call Spread Campaign
Let's walk through a 2-month campaign running call credit spreads.
Starting capital: $5,000 allocated to call spreads
Strategy: 30 DTE, 0.30 delta, $5 wide spreads, close at 50% profit or max 21 DTE
Week 1: Opening Positions
- Position 1: NVDA rallied from $420 to $460 in 3 weeks. Sell $470/$475 for $1.10. Risk: $390.
- Position 2: TSLA at $250, hit $255 resistance 3 times. Sell $255/$260 for $0.90. Risk: $410.
- Position 3: AMD at $135, RSI = 72. Sell $140/$145 for $1.00. Risk: $400.
Total credits: $300
Total capital deployed: $1,200
Week 3: First Exits
- NVDA: Stock pulled back to $455. Spread worth $0.50. Close for $0.60 profit (55% of max).
- TSLA: Still at $250. Holding.
- AMD: Stock dropped to $130. Spread worth $0.20. Close for $0.80 profit (80% of max).
Profits so far: $140
Week 5: More Management
- TSLA: Stock at $248 with 7 days left. Spread worth $0.30. Close for $0.60 profit (67% of max).
New positions opened:
- AAPL: At $180, sell $185/$190 for $1.10 (30 DTE)
- MSFT: At $360, sell $370/$375 for $1.00 (30 DTE)
Week 7: Month 2 Results
- AAPL: Stock at $182. Close at 50% profit = $0.55.
- MSFT: Stock rallied to $368. Roll to $375/$380 for $0.90, net loss $0.10 but extended position.
End of 2 Months
Total Trades: 6
Winners: 5
Partial losses/rolls: 1
Total profit: $140 + $60 + $55 = $255 on $1,200 deployed = 21% return in 2 months
Annualized: ~126%
Win rate: 83%
Common Call Credit Spread Mistakes
Mistake 1: Fighting Strong Momentum
Stock is up 30% in a month with strong volume and news catalysts. You sell call spreads betting on a pullback. Stock keeps rallying. You lose.
Fix: Don't fight the tape. Only sell call spreads when momentum is slowing (declining volume, overbought technicals, resistance overhead).
Mistake 2: Selling Into Catalysts
Stock has earnings, FDA approval, or product launch in 5 days. You sell call spreads. News is positive. Stock gaps up 15%. Max loss.
Fix: Check the calendar. Avoid expirations that overlap with major catalysts unless you're specifically playing IV crush.
Mistake 3: Ignoring Vega Risk
You sell call spreads when IV is low (20th percentile). Stock rallies 3% and IV spikes. Even though stock is still below your short strike, spread is now worth more due to IV expansion. You're underwater.
Fix: Only sell call spreads when IV percentile > 50%. You want IV to work in your favor (compress as stock consolidates). Learn more about how IV affects credit spread profitability.
Mistake 4: Too Narrow Strikes
You sell $105 call on a $100 stock with $108 long call ($3 wide). Stock rallies to $106. You're near max loss despite stock only moving 6%.
Fix: Use $5-10 wide spreads. Give yourself breathing room. $3 wide spreads are too tight unless you're very confident.
Mistake 5: Holding Losers Too Long
Stock rallied past your short strike. You're down 60% of max loss. You hold, hoping for a reversal. It doesn't come. Max loss.
Fix: Cut losses at 50% of max loss. Redeploy capital to better opportunities.
Mistake 6: Poor Position Sizing
You allocate 50% of your account to a single call credit spread. The trade goes against you, and a manageable $400 loss becomes a portfolio-damaging event.
Fix: Never risk more than 2-5% of your account on a single spread. Use our options position sizing calculator to determine the right number of contracts based on your account size and risk tolerance.
When Call Spreads Beat Put Spreads
Both strategies have the same ROI mechanics. The question is: which fits the market environment?
Use Call Credit Spreads When:
- Market is topping – Indices overbought, sentiment euphoric
- Stock-specific resistance – Clear technical ceiling
- Post-earnings fade setup – Good news priced in
- Valuation extreme – Meme stocks, parabolic charts
- You're bearish but don't want to short – Defined risk preferred
Use Put Credit Spreads When:
- Market is bottoming – Oversold conditions, panic selling
- Stock at support – Clear technical floor
- Post-selloff recovery setup – Bad news overdone
- Value opportunity – Quality stock pulled back on no news
- You're bullish but don't want to buy shares – Leverage preferred
Use Both (Iron Condor) When:
- Range-bound market – Choppy, no clear direction
- Low volatility – VIX < 20, stocks consolidating
- Post-big-move consolidation – After 10%+ rally or selloff
- Earnings IV crush – Play both sides of the fade
Advanced: Ratio Call Spreads
Once you master standard call spreads, you can explore ratio spreads for higher income.
Structure:
- Sell 2x $105 calls
- Buy 1x $110 call
- Net credit: Higher than standard spread
Example:
- Stock at $100
- Sell 2x $105 calls for $1.50 each = $300
- Buy 1x $110 call for $0.50 = $50
- Net credit: $2.50 ($250)
Risk:
- If stock stays below $105: Win $250 (full credit)
- If stock goes to $105-110: Partial profit
- If stock goes above $110: Unlimited loss on the uncovered call
Caution: Ratio spreads introduce naked call risk on the extra short call. Only use if you're experienced and have a stop-loss plan.
Better for most traders: Stick with 1:1 spreads (balanced call credit spreads).
Final Thoughts: Call Spreads as Bearish Income
Call credit spreads give you a way to profit from bearish views without the risk of shorting stock or buying expensive puts.
They're perfect for:
- Tactical plays on overbought stocks – When RSI > 70 and momentum is fading
- Fading rallies at resistance – When a stock has failed at a level multiple times
- Playing post-earnings IV crush – When you expect volatility to collapse after events
- Protecting a portfolio in a topping market – Hedge long exposure without buying puts
The Six Rules for Call Credit Spread Success
| Rule | Rationale | Common Mistake |
|---|---|---|
| 1. Sell 30 DTE as default | Optimal theta/probability balance | Going too short (7 DTE) or too long (60+ DTE) without reason |
| 2. Use 0.30 delta strikes | ~70% win rate historically | Selling 0.45 delta for more premium, getting tested constantly |
| 3. Keep spreads $5-10 wide | Manageable risk/reward | $2-wide spreads that don't justify the commission |
| 4. Only sell when IV percentile > 50% | Get paid for the risk you're taking | Selling into low IV, getting hurt by expansion |
| 5. Close at 50% profit | Don't grind for the last 30% | Holding to expiration for full credit, risking reversal |
| 6. Cut losses at 50% max loss | Protect capital for next trade | Hoping for recovery, taking full max loss |
Next Steps: From Reading to Trading
- Paper trade first – Open 2-3 call spreads on different stocks in a simulator
- Track your metrics – Win rate, average credit, average days held
- Build your watchlist – Identify stocks with clear resistance levels
- Add put spreads – Combine both for iron condors in range-bound markets
- Understand the math – Compare call spreads vs put spreads to know when to use each
- Plan your taxes – Review options tax implications for your situation
- Size positions correctly – Use our options position sizing calculator to determine contract count
- Track your trades – Maintain an options trading journal to identify patterns in your winners and losers
Ready to Apply This Framework?
The concepts in this guide—delta-based strike selection, DTE optimization, mechanical management—are built into the Days to Expiry platform:
- Strategy Analyzer – Screen for call credit spread candidates with live delta, IV, and premium data
- Portfolio Scanner – Monitor existing spreads for management triggers (50% profit, 21 DTE)
- Demo Portfolio – See how call spreads fit into a complete options income strategy
Start with the Strategy Analyzer to find your first call credit spread opportunity. Filter by bearish outlook, 30 DTE, and 0.30 delta—exactly the framework outlined in this guide.
Related Articles
Expand your credit spread knowledge with these related guides:
Core Credit Spread Strategies
- Put Credit Spreads: Risk-Defined Income Strategy – The bullish counterpart to call credit spreads
- Bear Call Spread Strategy – Deep dive into bearish call spread adjustments
- Call Spreads vs Put Spreads – Side-by-side comparison of credit spread directions
Advanced Spread Concepts
- Iron Condor Strategy: Profit from Range-Bound Markets – Combine call and put spreads for neutral income
- Best DTE for Credit Spreads – Data-driven expiration analysis
- Credit Spread Width & DTE – How strike width affects risk and reward
- Vertical Spread Options Guide – Complete vertical spread framework
Risk Management & Greeks
- Options Greeks Explained – Master theta, delta, and vega for spreads
- Options Buying Power Requirements – Capital requirements by strategy
- Gamma Risk Near Expiration – Critical risks for short-dated spreads
Alternative Strategies
- Poor Man's Covered Call – Diagonal call strategy for capital efficiency
- Diagonal Spread Strategy – Advanced spread techniques
- Bull Call Spread DTE – Debit spread approach for bullish outlooks
- Short Strangle Strategy – Higher premium collection with undefined risk
- Butterfly Spread Options – Low-risk directional plays with limited profit
Tax & Portfolio Management
- Complete Options Tax Guide – Reporting requirements and tax-efficient strategies
- Options Trading Journal – Track performance and improve your edge
- Options Portfolio Management – Balance multiple spread positions
- SPY vs SPX Options – Tax advantages of index options
Backtesting & Analysis
- Options Backtesting Guide – Validate strategies with historical data
- Options Risk Management – Protect your capital
- 21 DTE Rule Explained – When to close positions early
- When to Roll vs Close – Management decision framework
Frequently Asked Questions
Written by Days to Expiry Trading Team
The Days to Expiry team focuses on mechanical, probability-based options strategies for individual traders. All content is grounded in real P&L data and historical backtests.
Apply The Strategy